
Compare SBEC Sugar with Similar Stocks
Dashboard
Weak Long Term Fundamental Strength with a -214.01% CAGR growth in Operating Profits over the last 5 years
- Low ability to service debt as the company has a high Debt to EBITDA ratio of -57.20 times
- The company has been able to generate a Return on Equity (avg) of 2.23% signifying low profitability per unit of shareholders funds
Risky - Negative EBITDA
Total Returns (Price + Dividend) 
SBEC Sugar for the last several years.
Risk Adjusted Returns v/s
Returns Beta

News
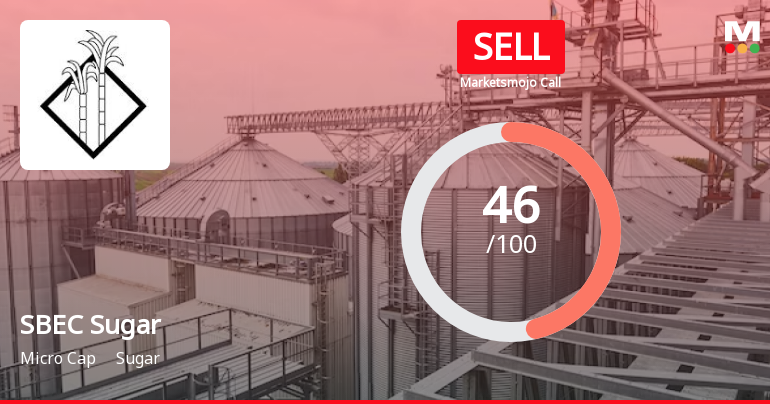
SBEC Sugar Ltd is Rated Sell
SBEC Sugar Ltd is rated 'Sell' by MarketsMOJO, with this rating last updated on 03 June 2026. However, the analysis and financial metrics discussed here reflect the stock’s current position as of 26 June 2026, providing investors with an up-to-date view of the company’s fundamentals, valuation, financial trends, and technical outlook.
Read full news article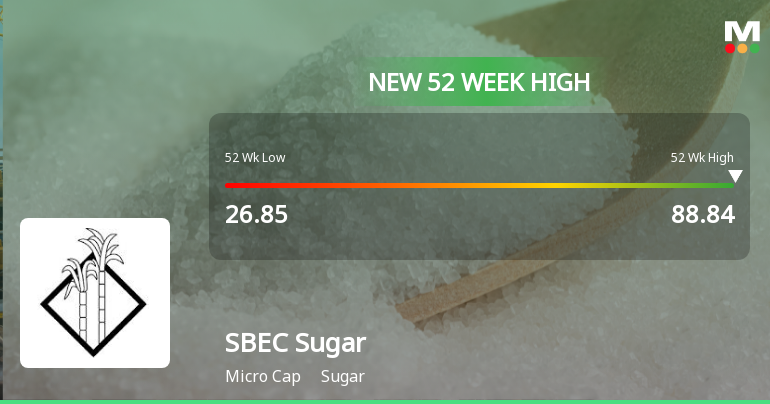
Broad-Based Technical Strength Lifts SBEC Sugar Ltd to 52-Week High of Rs 88.84
Surging to a fresh 52-week high of Rs 88.84 on 19 Jun 2026, SBEC Sugar Ltd has demonstrated remarkable momentum, rallying over 205% in the past 16 trading sessions. This impressive price action unfolds amid a broader market backdrop where the Sensex trades lower by 0.92%, underscoring the stock’s distinct strength in the sugar sector.
Read full news article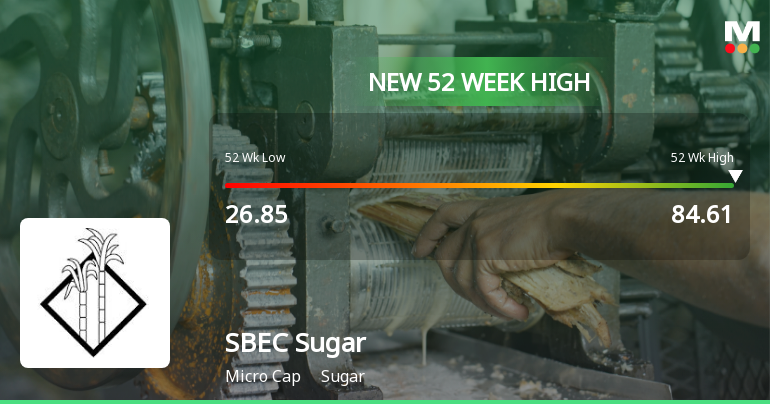
Broad-Based Technical Strength Lifts SBEC Sugar Ltd to 52-Week High of Rs 84.61
With a remarkable 191.26% gain over the past 15 trading sessions, SBEC Sugar Ltd surged to a fresh 52-week high of Rs 84.61 on 18 Jun 2026, outpacing its sector and the broader market. This rally is underpinned by a confluence of bullish technical indicators and sustained price momentum that have propelled the stock well above all key moving averages.
Read full news article Announcements
Closure of Trading Window
24-Jun-2026 | Source : BSEClosure of Trading Window with effect from July 01 2026 till 48 hours after the declaration of financial results for the quarter ended June 30 2026
Announcement Under Regulation 30 Of SEBI (LODR) Regulations 2015 For Entering Into Agreement For Inter Corporate Deposit
19-Jun-2026 | Source : BSEAnnouncement under Regulation 30 of SEBI (LODR) Regulations 2015 for entering into agreement for inter Corporate Deposit with M/s Longwell Investment Private Limited
Announcement under Regulation 30 (LODR)-Newspaper Publication
31-May-2026 | Source : BSENewspaper publication as per Regulation 47 of SEBI (LODR) Regulations 2015
Corporate Actions

No Upcoming Board Meetings

No Dividend history available

No Splits history available

No Bonus history available

No Rights history available
Quality key factors
Valuation key factors
Technicals key factors
 Technical Indicator Scale: Bearish, Mildly Bearish, Sideways, Mildly Bullish, Bullish Turned
 Shareholding Snapshot : Mar 2026
Shareholding Compare (%holding)
Promoters
None
Held by 0 Schemes
Held by 0 FIIs
Sbec Systems India Limited (29.86%)
Abhikum Leasing And Investments Private Limited (11.81%)
15.15%
Quarterly Results Snapshot (Consolidated) - Mar'26 - QoQ

QoQ Growth in quarter ended Mar 2026 is 29.21% vs -16.19% in Dec 2025
QoQ Growth in quarter ended Mar 2026 is 623.64% vs 39.47% in Dec 2025
Half Yearly Results Snapshot (Consolidated) - Sep'25

Growth in half year ended Sep 2025 is -4.20% vs 2.60% in Sep 2024
Growth in half year ended Sep 2025 is -28.09% vs -1.55% in Sep 2024
Nine Monthly Results Snapshot (Consolidated) - Dec'25
YoY Growth in nine months ended Dec 2025 is -7.56% vs 1.46% in Dec 2024
YoY Growth in nine months ended Dec 2025 is -10.73% vs -47.00% in Dec 2024
Annual Results Snapshot (Consolidated) - Mar'26
YoY Growth in year ended Mar 2026 is -13.01% vs -3.67% in Mar 2025
YoY Growth in year ended Mar 2026 is -61.21% vs 497.52% in Mar 2025
About SBEC Sugar Ltd

Company Coordinates


