
Compare Reliance Infra. with Similar Stocks
Dashboard
With a Operating Losses, the company has a Weak Long Term Fundamental Strength
- Poor long term growth as Operating profit has grown by an annual rate 9.65% of over the last 5 years
- Low ability to service debt as the company has a high Debt to EBITDA ratio of 4.92 times
Negative results in Mar 26
Risky - Negative Operating Profits
Despite the size of the company, domestic mutual funds hold only 0.64% of the company
Below par performance in long term as well as near term
Total Returns (Price + Dividend) 
Latest dividend: 9.500000000000002 per share ex-dividend date: Sep-12-2018
Risk Adjusted Returns v/s
Returns Beta

News
Reliance Infrastructure Ltd Opens 5% Lower in Sharp Gap Down as Technicals Point to Further Weakness
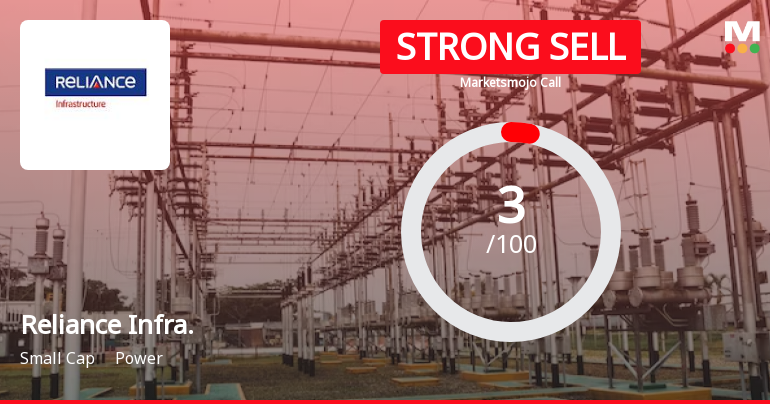
Reliance Infrastructure Ltd is Rated Strong Sell
Reliance Infrastructure Ltd is rated Strong Sell by MarketsMOJO, with this rating last updated on 05 February 2026. However, the analysis and financial metrics discussed here reflect the company’s current position as of 12 July 2026, providing investors with an up-to-date perspective on the stock’s fundamentals, valuation, financial trends, and technical outlook.
Read full news article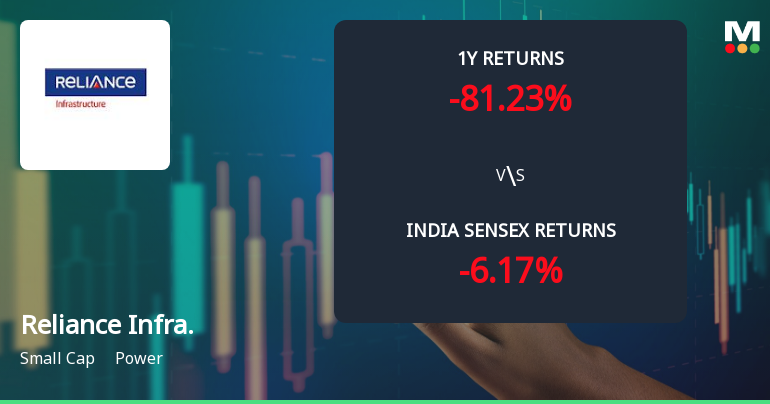
Reliance Infrastructure Ltd Faces Intensified Downtrend Amid Technical Weakness
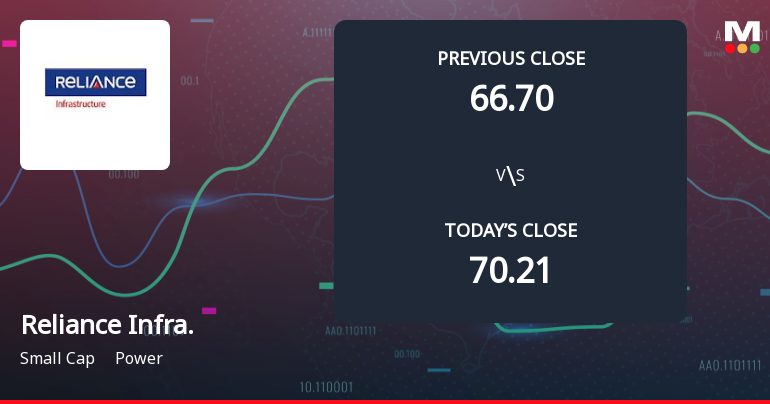
Reliance Infrastructure Ltd (NSE: 400868) has experienced a marked deterioration in its technical outlook, with key momentum indicators signalling a shift from mild bearishness to a more pronounced downtrend. The stock’s current price of ₹70.21, down 4.99% on the day, reflects mounting selling pressure amid weak technical signals across multiple timeframes, raising concerns for investors amid a challenging market environment.
Read full news article Announcements
Disclosure Under Regulation 30 Of The Securities And Exchange Board Of India (Listing Obligations And Disclosure Requirements) Regulations 2015
10-Jul-2026 | Source : BSEDisclosure under Regulation 30 of the Securities and Exchange Board of India (Listing Obligations and Disclosure Requirements) Regulations 2015
Disclosure Under Regulation 30 Of The Securities And Exchange Board Of India (Listing Obligations And Disclosure Requirements) Regulations 2015
07-Jul-2026 | Source : BSEDisclosure under Regulation 30 of the Securities and Exchange Board of India (Listing Obligations and Disclosure Requirements) Regulations 2015
Closure of Trading Window
26-Jun-2026 | Source : BSEClosure of Trading Window
Corporate Actions

No Upcoming Board Meetings

Reliance Infrastructure Ltd has declared 95% dividend, ex-date: 12 Sep 18

No Splits history available

No Bonus history available

No Rights history available
Quality key factors
Valuation key factors
Technicals key factors
 Technical Indicator Scale: Bearish, Mildly Bearish, Sideways, Mildly Bullish, Bullish Turned
 Shareholding Snapshot : Mar 2026
Shareholding Compare (%holding)
Non Institution
None
Held by 42 Schemes (0.52%)
Held by 135 FIIs (5.53%)
Risee Infinity Private Limited (18.87%)
Authum Investment & Infrastructure Limited (10.12%)
47.22%
Quarterly Results Snapshot (Consolidated) - Mar'26 - QoQ

QoQ Growth in quarter ended Mar 2026 is -6.87% vs -31.09% in Dec 2025
QoQ Growth in quarter ended Mar 2026 is 8,156.03% vs -99.42% in Dec 2025
Half Yearly Results Snapshot (Consolidated) - Sep'25

Growth in half year ended Sep 2025 is -15.97% vs 13.41% in Sep 2024
Growth in half year ended Sep 2025 is -48.79% vs 498.05% in Sep 2024
Nine Monthly Results Snapshot (Consolidated) - Dec'25
YoY Growth in nine months ended Dec 2025 is -15.63% vs 12.10% in Dec 2024
YoY Growth in nine months ended Dec 2025 is 260.10% vs 139.65% in Dec 2024
Annual Results Snapshot (Consolidated) - Mar'26
YoY Growth in year ended Mar 2026 is -13.36% vs 6.91% in Mar 2025
YoY Growth in year ended Mar 2026 is -41.26% vs 406.93% in Mar 2025
About Reliance Infrastructure Ltd

Company Coordinates


