
Compare Cambridge Tech. with Similar Stocks
Stock DNA
Computers - Software & Consulting
INR 67 Cr (Micro Cap)
141.00
19
0.00%
0.84
0.58%
0.83
Total Returns (Price + Dividend) 
Latest dividend: 0.4000 per share ex-dividend date: Oct-16-2008
Risk Adjusted Returns v/s
Returns Beta

News
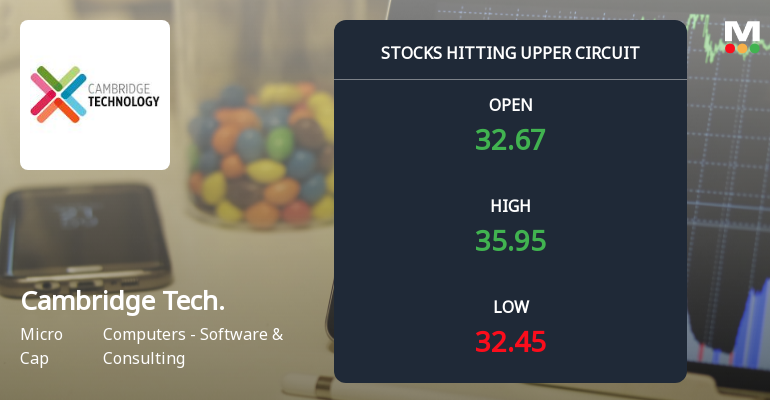
Cambridge Technology Enterprises Ltd Locks at Upper Circuit With 8.32% Gain — Buyers Queue, Sellers Absent
At Rs 33.96, the buying was done — not because demand dried up, but because the exchange wouldn't let the stock go any higher. Cambridge Technology Enterprises Ltd locked at its upper circuit of 8.32% on 29 Jul 2026, with buyers queuing and no sellers willing to part with shares.
Read full news article
Cambridge Technology Enterprises Ltd is Rated Sell
Cambridge Technology Enterprises Ltd is rated 'Sell' by MarketsMOJO, with this rating last updated on 01 June 2026. However, the analysis and financial metrics discussed here reflect the stock's current position as of 21 July 2026, providing investors with an up-to-date perspective on the company’s fundamentals, valuation, financial trends, and technical outlook.
Read full news article
Cambridge Technology Enterprises Ltd is Rated Sell
Cambridge Technology Enterprises Ltd is rated 'Sell' by MarketsMOJO, with this rating last updated on 01 June 2026. However, the analysis and financial metrics discussed here reflect the stock's current position as of 10 July 2026, providing investors with an up-to-date view of the company’s fundamentals, valuation, financial trends, and technical outlook.
Read full news article Announcements
Announcement under Regulation 30 (LODR)-Change in Management
24-Jul-2026 | Source : BSEWe wish to inform your esteemed organization(s) that Mr. Stefan Hetges Non-Executive and Non-independent Director of the Company has tendered his resignation from the close of business hours on July 24 2026.
Announcement under Regulation 30 (LODR)-Change in Directorate
24-Jul-2026 | Source : BSEWe wish to inform your esteemed organization(s) that Mr. Stefan Hetges Non-Executive and Non-Independent Director of the Company has tendered resignation with effect from close of business hours on July 24 2026.
Announcement under Regulation 30 (LODR)-Newspaper Publication
22-Jul-2026 | Source : BSENewspaper Publication regarding the Postal Ballot Notice
Corporate Actions

No Upcoming Board Meetings

Cambridge Technology Enterprises Ltd has declared 5% dividend, ex-date: 16 Oct 08

No Splits history available

No Bonus history available

No Rights history available
Quality key factors
Valuation key factors
Technicals key factors
 Technical Indicator Scale: Bearish, Mildly Bearish, Sideways, Mildly Bullish, Bullish Turned
 Shareholding Snapshot : Jun 2026
Shareholding Compare (%holding)
Promoters
None
Held by 0 Schemes
Held by 0 FIIs
Cloud Computing Llc (57.13%)
Devinder Parkash Kalra (2.64%)
35.39%
Quarterly Results Snapshot (Consolidated) - Mar'26 - QoQ

QoQ Growth in quarter ended Mar 2026 is -14.73% vs 6.03% in Dec 2025

QoQ Growth in quarter ended Mar 2026 is 207.20% vs 123.99% in Dec 2025
Half Yearly Results Snapshot (Consolidated) - Sep'25
Growth in half year ended Sep 2025 is -2.52% vs 0.56% in Sep 2024
Growth in half year ended Sep 2025 is 87.65% vs -423.08% in Sep 2024
Nine Monthly Results Snapshot (Consolidated) - Dec'25
YoY Growth in nine months ended Dec 2025 is -4.89% vs -0.52% in Dec 2024
YoY Growth in nine months ended Dec 2025 is 91.94% vs -2,140.49% in Dec 2024
Annual Results Snapshot (Consolidated) - Mar'26
YoY Growth in year ended Mar 2026 is -8.99% vs -3.54% in Mar 2025
YoY Growth in year ended Mar 2026 is 101.00% vs -961.29% in Mar 2025
About Cambridge Technology Enterprises Ltd

Company Coordinates


