KSE

INR
178.35
-0.2 (-0.11%)
BSENSE

Aug 28, 03:30 PM

BSE+NSE Vol: 4.84 k

  • Price Points
  • Score
  • Mojo Parameters
  • Total Return
  • News and Corporate Actions
  • Key factors
  • Shareholding
  • Financials
  • CompanyCV
stock-summaryPrice Point
High/Low

1Day

52 Week

Valuation
Technical
Day's Volume

CASH

4.84 k (-59.75%) Volume

Shareholding (Jun 2026)

FII

0.08%

Held by 1 FIIs

DII

0.02%

Held by 0 DIIs

Promoter

22.95%

Why is KSE Ltd falling/rising?

29-Aug-2026

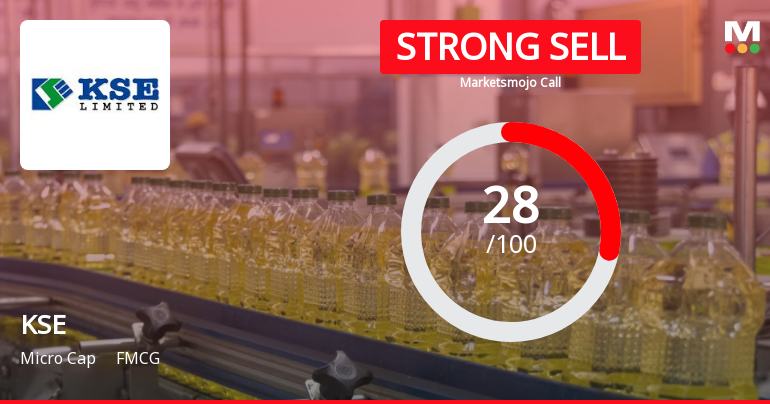
As of 28-Aug, KSE Ltd's stock price is Rs 178.35, reflecting a 0.11% decrease and a significant 20.00% decline year-to-date. The stock is underperforming against the Sensex and shows bearish trends, with decreased investor participation and proximity to its 52-week low.

As of 28-Aug, KSE Ltd's stock price is falling, currently at Rs 178.35, which reflects a decrease of Rs 0.2 or 0.11%. The stock has been on a downward trend, having lost 0.86% over the last two days and showing a significant decline of 20.00% year-to-date, compared to a lesser decline of 9.34% in the benchmark Sensex. <BR><BR>In terms of performance, KSE Ltd has underperformed against the Sensex over various periods, including a 1-month decline of 8.26% while the Sensex gained 0.65%. Furthermore, the stock is currently trading below its 5-day, 20-day, 50-day, 100-day, and 200-day moving averages, indicating a bearish trend. <BR><BR>Investor participation has also decreased, with delivery volume on 27 August dropping by 76.93% compared to the 5-day average, suggesting a lack of interest from investors. Additionally, the stock is close to its 52-week low, being only 2.47% away from Rs 174. <BR><BR>Despite a high dividend yield of 9.85%, the overall indicators point to a continued decline in KSE Ltd's stock price.

View full answer

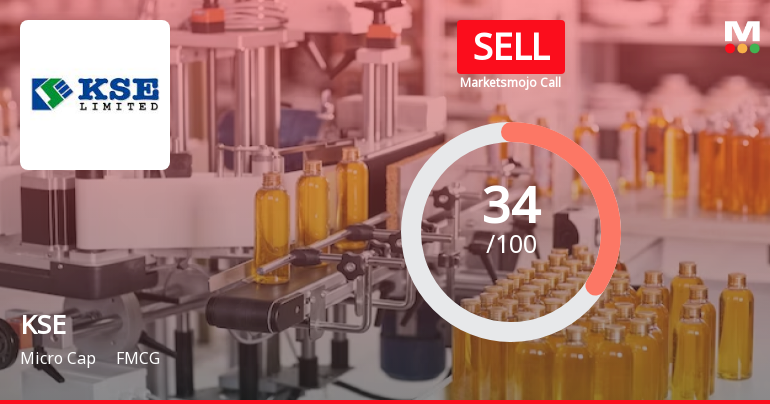
Should I buy, sell or hold KSE Ltd?

25-Aug-2026

Who are in the management team of KSE?

14-Aug-2026

The management team of KSE includes M P Jackson (Managing Director), Jose John (Chairman), and several directors, independent directors, and non-executive directors, with Srividya Damodaran serving as CFO. This diverse team oversees the company's governance and management.

The management team of KSE includes the following individuals:<BR><BR>1. **M P Jackson** - Managing Director<BR>2. **Jose John** - Chairman & Independent Director<BR>3. **P D Anto** - Director<BR>4. **Marykutty Varghese** - Director<BR>5. **Paul Francis K** - Director<BR>6. **K C Pyarelal** - Director<BR>7. **Danesa Raghulal** - Director<BR>8. **Dony A.G.** - Director<BR>9. **Verghese C V** - Independent Director<BR>10. **Nina Paul** - Independent Director<BR>11. **Paul Jose** - Independent Director<BR>12. **Simi Davis** - Non Executive Director<BR>13. **Seema Davis** - Non Executive Director<BR>14. **Jose Paul Thailyath** - Non Executive Director<BR>15. **Srividya Damodaran** - CFO / CS / Compliance Officer<BR><BR>This team comprises a mix of directors, independent directors, and executive roles, contributing to the governance and management of the company.

View full answer

What does KSE do?

14-Aug-2026

KSE Ltd is a Micro Cap company in the FMCG sector, specializing in ready mixed cattle feed, oil extraction, and milk processing. As of March 2026, it reported net sales of 409 Cr and a net loss of 4 Cr, with a market cap of INR 669 Cr.

Overview:<BR>KSE Ltd operates in the FMCG industry, specializing in the manufacture of ready mixed cattle feed, oil extraction from oil cakes, and processing of milk and milk products, and is categorized as a Micro Cap company.<BR><BR>History:<BR>Incorporated in 1963, KSE Ltd was formerly known as Kerala Solvent Extractions Ltd. The company reported its latest quarterly results for March 2026, showing net sales and profit figures.<BR><BR>Financial Snapshot:<BR>Most recent Net Sales: 409 Cr (Quarterly Results - Mar 2026) <BR>Most recent Net Profit: -4 Cr (Quarterly Results - Mar 2026) <BR>Market-cap value: INR 669 Cr (Micro Cap)<BR><BR>Key Metrics:<BR>P/E: 8.00 <BR>Industry P/E: 20 <BR>Dividend Yield: 4.81% <BR>Debt Equity: -0.47 <BR>Return on Equity: 24.05% <BR>Price to Book: 1.91 <BR><BR>Contact Details:<BR>Address: P B No 20, Solvent Road Irinjalakuda Kerala : 680121 <BR>Phone: 91-480-2825476/2826676 <BR>Email: ksekerala@gmail.com <BR>Website: http://www.kselimited.com

View full answer

Who are the peers of the KSE?

14-Aug-2026

KSE's peers include Mukka Proteins, Sheetal Cool, Nurture Well Ind, Universus Photo, Mcleod Russel, Proventus Agro, and Euro India Fresh. KSE has excellent management and capital structure, but its 1-year return of -10.16% is lower than peers, with Nurture Well Ind showing the highest return at 17.59%.

Peers: The peers of KSE are Mukka Proteins, Sheetal Cool, Nurture Well Ind, Universus Photo, Mcleod Russel, Proventus Agro, and Euro India Fresh.<BR><BR>Quality Snapshot: Excellent management risk is observed at KSE and Nurture Well Ind, while Average management risk is found at Sheetal Cool, KSE, Nurture Well Ind, and Universus Photo, and Below Average management risk is noted at Mukka Proteins, Mcleod Russel, Proventus Agro, and Euro India Fresh. Growth is Excellent at Nurture Well Ind, Average at Sheetal Cool, KSE, and Universus Photo, and Below Average at Mukka Proteins, Mcleod Russel, and Euro India Fresh. Capital Structure is Excellent at KSE and Nurture Well Ind, Good at Universus Photo, Average at Sheetal Cool, and Below Average at Mukka Proteins, Mcleod Russel, Proventus Agro, and Euro India Fresh.<BR><BR>Return Snapshot: The peer with the highest 1-year return is Apis India at 226.39%, while the lowest is Nurture Well Ind at 17.59%, and KSE's 1-year return of -10.16% is lower than both. Additionally, Nurture Well Ind and Mcleod Russel have negative six-month returns.

View full answer

How big is KSE?

14-Aug-2026

As of 14th August, KSE Ltd has a market capitalization of 665.44 Cr, with Net Sales of 1680.48 Cr and a Net Profit of 84.04 Cr reported in the latest four quarters. Shareholder's Funds are 349.50 Cr and Total Assets are valued at 414.98 Cr as of March 2026.

As of 14th August, KSE Ltd has a market capitalization of 665.44 Cr and is classified as a Micro Cap company.<BR><BR>In the latest four quarters, KSE Ltd reported Net Sales of 1680.48 Cr and a Net Profit of 84.04 Cr.<BR><BR>For the reporting period of March 2026, KSE Ltd's Shareholder's Funds amounted to 349.50 Cr, while Total Assets were valued at 414.98 Cr.

View full answer

Are KSE Ltd latest results good or bad?

21-May-2026

KSE Ltd's latest results are concerning, reporting a net loss of ₹3.73 crores in Q4 FY26, a 122.81% decline from the previous quarter, alongside a significant drop in operating margins to -1.29%. Overall, the financial performance indicates operational challenges and negative investor sentiment.

The latest results for KSE Ltd are concerning and can be classified as bad. In the fourth quarter of FY26, the company reported a net loss of ₹3.73 crores, marking a significant decline of 122.81% compared to the previous quarter and a drastic drop from a profit in the same quarter last year. This loss is compounded by a severe collapse in operating margins, which fell to -1.29%, the lowest in eight quarters, from 5.18% in the prior quarter.<BR><BR>While the revenue for Q4 FY26 was ₹409.16 crores, this represents a 4.39% decline from the previous quarter, although it did show a slight year-on-year growth of 4.43%. However, the overall financial performance indicates operational challenges, with the operating profit before depreciation, interest, tax, and other income plummeting to a negative ₹5.28 crores.<BR><BR>The company has also faced a decline in its share price, which has dropped 14.13% year-to-date and is trading significantly below its 52-week high. Given these factors, investor sentiment appears to be negative, reflecting concerns about KSE's operational execution and margin sustainability. Overall, the results suggest a critical need for management to address these operational issues moving forward.

View full answer

When is the next results date for KSE Ltd?

10-Feb-2026

The next results date for KSE Ltd is 14 February 2026.

The next results date for KSE Ltd is scheduled for 14 February 2026.

View full answer

How has been the historical performance of KSE?

17-Nov-2025

KSE's historical performance shows a recovery in profitability and operational efficiency, with operating profit rising significantly and cash flow improving, despite a slight decline in net sales and earnings per share. Total assets and liabilities increased, indicating growth in the company's financial position.

Answer:<BR>The historical performance of KSE shows a fluctuating trend in key financial metrics over the past several years.<BR><BR>Breakdown:<BR>KSE's net sales peaked at 1,683.49 Cr in Mar'24 but decreased to 1,649.53 Cr in Mar'25, reflecting a slight decline. Total operating income followed a similar pattern, decreasing from 1,683.49 Cr in Mar'24 to 1,649.53 Cr in Mar'25. The raw material cost also saw a decline from 1,362.35 Cr in Mar'24 to 1,241.87 Cr in Mar'25, while total expenditure decreased from 1,651.55 Cr to 1,529.34 Cr in the same period. Operating profit, excluding other income, significantly improved from 31.94 Cr in Mar'24 to 120.19 Cr in Mar'25, leading to an operating profit margin increase to 7.29%. Profit before tax rose to 122.72 Cr in Mar'25 from 24.24 Cr in Mar'24, resulting in a profit after tax of 91.31 Cr, up from 17.61 Cr. The earnings per share (EPS) decreased to 28.53 from 55.03, while the book value per share increased to 927.33 from 702.62. Total assets grew from 277.26 Cr in Mar'24 to 356.46 Cr in Mar'25, and total liabilities also increased to 356.46 Cr from 277.26 Cr. Cash flow from operating activities improved to 142 Cr in Mar'25 from -15 Cr in Mar'24, indicating a positive cash flow trend. Overall, KSE's financial performance reflects a recovery in profitability and operational efficiency despite fluctuations in sales and EPS.

View full answer

Is KSE technically bullish or bearish?

13-Nov-2025

As of November 12, 2025, the KSE trend is mildly bullish with supportive indicators like a bullish MACD, but caution is advised due to mildly bearish signals from the KST.

As of 12 November 2025, the technical trend for KSE has changed from bullish to mildly bullish. The current stance is mildly bullish, supported by a bullish MACD on both weekly and monthly time frames, and mildly bullish signals from Bollinger Bands and daily moving averages. However, the KST indicates a mildly bearish trend on both weekly and monthly time frames, and Dow Theory shows no clear trend. The RSI is neutral with no signals on both time frames. Overall, while there are bullish indicators, the presence of mildly bearish signals from KST suggests caution.

View full answer

Who are the top shareholders of the KSE?

17-Jul-2025

The top shareholders of KSE are primarily individual investors, holding 42.32% of shares, with George A P as the largest promoter at 1.58%. Notably, there are no pledged promoter holdings or mutual fund shares in KSE.

The top shareholders of KSE include a mix of individual and institutional investors. The majority of the shares are held by non-institutional shareholders, with individual investors holding a significant 42.32% of the total shares. The promoter with the highest holding is George A P, who owns 1.58%. Additionally, there is one foreign institutional investor (FII) that holds 0.08% of the shares. Notably, there are no pledged promoter holdings or mutual fund schemes currently holding shares in KSE. The highest public shareholder is Pjd Properties & Investment Pvt Ltd, which holds 0%.

View full answer

Is KSE overvalued or undervalued?

09-Jun-2025

As of November 12, 2024, KSE is considered very attractive and undervalued with a PE ratio of 8.66 and strong growth potential, especially compared to peers like Guj. Ambuja Exp and Gokul Agro, despite a recent stock price decline.

As of 12 November 2024, the valuation grade for KSE has moved from attractive to very attractive, indicating a positive shift in its perceived value. The company is currently considered undervalued, with a PE ratio of 8.66, an EV to EBITDA ratio of 6.24, and a PEG ratio of just 0.03, suggesting strong growth potential relative to its price. <BR><BR>In comparison to its peers, KSE's valuation metrics stand out; for instance, Guj. Ambuja Exp has a PE ratio of 21.62 and an EV to EBITDA of 12.09, while Gokul Agro is at 16.88 and 8.11 respectively. This highlights KSE's attractive pricing in the FMCG sector. Despite a recent decline in stock price compared to the Sensex, KSE has shown a solid 1-month return of 29.88%, reinforcing its undervalued status amidst a competitive landscape.

View full answer

Has KSE declared dividend?

06-Jun-2025

KSE Ltd has declared a 300% dividend, amounting to 30 per share, with an ex-date of February 18, 2025. The company has shown positive total returns over various periods, particularly strong in the long term.

KSE Ltd has declared a 300% dividend.<BR><BR>Dividend Details:<BR>- Percentage announced: 300%<BR>- Amount per share: 30<BR>- Ex-date: 18 Feb 25<BR><BR>Dividend Yield: 2.48%.<BR><BR>Total Returns by Period:<BR>In the last 6 months, KSE Ltd experienced a price return of -1.59%, a dividend return of 1.22%, resulting in a total return of -0.37%.<BR><BR>Over the past year, the company achieved a price return of 9.93%, with a dividend return of 2.55%, leading to a total return of 12.48%.<BR><BR>In the 2-year period, KSE Ltd reported a price return of 45.45%, a dividend return of 4.88%, culminating in a total return of 50.33%.<BR><BR>For the 3-year period, the price return was 16.48%, the dividend return was 5.30%, resulting in a total return of 21.78%.<BR><BR>In the last 4 years, KSE Ltd had a price return of 0.14%, a dividend return of 7.09%, which resulted in a total return of 7.23%.<BR><BR>Over the 5-year period, the company saw a price return of 72.69%, a dividend return of 14.62%, leading to an impressive total return of 87.31%.<BR><BR>Overall, KSE Ltd has declared a substantial dividend and has shown positive total returns over various periods, particularly strong in the longer term, indicating a favorable performance for shareholders.

View full answer
iScoreScore
Click here to find our call on this stock
Strong Sell
Sell
Hold
Buy
Strong Buy

Dashboard

1

Poor long term growth as Operating profit has grown by an annual rate -14.20% of over the last 5 years

 
2

Negative results in Jun 26

3

Despite the size of the company, domestic mutual funds hold only 0% of the company

4

Below par performance in long term as well as near term

stock-summaryMojo Parameters

Mojo Parameters

Loading Valuation Snapshot...

Stock DNA

stock-summary
Industry

FMCG

stock-summary
Market cap

INR 576 Cr (Micro Cap)

stock-summary
P/E

12.00

stock-summary
Industry P/E

20

stock-summary
Dividend Yield

9.85%

stock-summary
Debt Equity

-0.47

stock-summary
Return on Equity

13.19%

stock-summary
Price to Book

1.63

Revenue and Profits:
Net Sales:
454 Cr
(Quarterly Results - Jun 2026)
Net Profit:
1 Cr
stock-summaryTotal Returns
Total Returns (Price + Dividend) stock-summary
Dividend Yield (9.85%)
TimePeriod
Price Return
Dividend Return
Total Return
3 Months
-6.96%
3.93%
-3.03%
6 Months
-16.11%
3.69%
-12.42%
1 Year
-23.69%
6.86%
-16.83%
2 Years
-36.6%
8.54%
-28.06%
3 Years
11.59%
14.33%
25.92%
4 Years
-8.77%
13.33%
4.56%
5 Years
-12.02%
12.48%
0.46%

Latest dividend: 7.489809782608695 per share ex-dividend date: Aug-21-2026

Risk Adjusted Returns v/s stock-summary
Returns Beta
Icon
Beta has not been calculated since enough price history is not available
stock-summaryNews & Corporate Actions

News

KSE Ltd Falls 11.64%: Valuation Upgrade Amidst Volatile Week

Announcements stock-summary

Intimation Regarding Corrigendum To The Notice Of The 62Nd Annual General Meeting - 29.08.2026

20-Aug-2026 | Source : BSE

Attaching herewith the Corrigendum Notice of AGM along with revised AGM Notice.

Announcement under Regulation 30 (LODR)-Newspaper Publication

15-Aug-2026 | Source : BSE

Enclosing herewith the extracts of newspaper publication of unaudited financials for the quarter ended 30.06.2026

Unaudited Financial Results For Quarter Ended 30Th June 2026 Pursuant To Regulations 30 33 And 47 Of SEBI (Listing Obligations And Disclosure Requirements) Regulations 201

14-Aug-2026 | Source : BSE

Enclosing herewith the unaudited Financial results for the quarter ended 30.06.2026

Corporate Actions stock-summary

stock-summary
BOARD MEETING

No Upcoming Board Meetings

stock-summary
DIVIDEND

KSE Ltd has declared 750% dividend, ex-date: 21 Aug 26

stock-summary
SPLITS

KSE Ltd has announced 1:10 stock split, ex-date: 28 Oct 25

stock-summary
BONUS

No Bonus history available

stock-summary
RIGHTS

No Rights history available

stock-summaryKey Factors

Quality key factors stock-summary

Factor
Value
Sales Growth (5y)
1.82%
EBIT Growth (5y)
-14.20%
EBIT to Interest (avg)
17.79
Debt to EBITDA (avg)
Negative Net Debt
Net Debt to Equity (avg)
-0.47
Sales to Capital Employed (avg)
6.04
Tax Ratio
26.76%
Dividend Payout Ratio
28.04%
Pledged Shares
0
Institutional Holding
0.09%
ROCE (avg)
56.15%
ROE (avg)
13.39%

Valuation key factors

Factor
Value
P/E Ratio
12
Industry P/E
20
Price to Book Value
1.63
EV to EBIT
7.93
EV to EBITDA
6.82
EV to Capital Employed
2.20
EV to Sales
0.24
PEG Ratio
NA
Dividend Yield
9.81%
ROCE (Latest)
54.82%
ROE (Latest)
13.19%

Technicals key factors

Indicator
Weekly
Monthly
MACD
Mildly Bullish
Bearish
RSI
No Signal
No Signal
Bollinger Bands
Bearish
Bearish
Moving Averages
Bearish (Daily)
KST
Mildly Bullish
Bearish
Dow Theory
Mildly Bearish
No Trend
OBV
No Trend
No Trend
stock-summary Technical Indicator Scale: Bearish, Mildly Bearish, Sideways, Mildly Bullish, Bullish  Turned 
stock-summaryShareholding
Shareholding Snapshot : Jun 2026stock-summary
Shareholding Compare (%holding) stock-summary
Majority shareholders

Non Institution

Pledged Promoter Holdings

None

Mutual Funds

Held by 0 Schemes

FIIs

Held by 1 FIIs (0.08%)

Promoter with highest holding

Jackson M P (1.4%)

Highest Public shareholder

Pjd Properties & Investment Pvt Ltd (19.52%)

Individual Investors Holdings

39.09%

stock-summaryFinancial
[
  {
    "link": "quarterly",
    "btn_text": "All Quarterly Results",
    "header": "Quarterly Results Snapshot (Standalone) - Jun'26 - QoQ",
    "rhs": [
      {
        "prefix": "Net Sales ",
        "suffix": "QoQ Growth in quarter ended Jun 2026 is 10.88% vs -4.39% in Mar 2026",
        "dir": 1
      },
      {
        "prefix": "Standalone Net Profit ",
        "suffix": "QoQ Growth in quarter ended Jun 2026 is 125.20% vs -122.81% in Mar 2026",
        "dir": 1
      }
    ],
    "table": {
      "header": [
        "Jun'26",
        "Mar'26",
        "Change(%)"
      ],
      "body": [
        {
          "field": "Net Sales",
          "val1": "453.67",
          "val2": "409.16",
          "chgp": "10.88%",
          "chgp_class": "positive"
        },
        {
          "field": "Operating Profit (PBDIT) excl Other Income",
          "val1": "-0.23",
          "val2": "-5.28",
          "chgp": "95.64%",
          "chgp_class": "positive"
        },
        {
          "field": "Interest",
          "val1": "0.67",
          "val2": "0.65",
          "chgp": "3.08%",
          "chgp_class": "negative"
        },
        {
          "field": "Exceptional Items",
          "val1": "0.47",
          "val2": "0.00",
          "chgp": "",
          "chgp_class": "neutral"
        },
        {
          "field": "Standalone Net Profit",
          "val1": "0.94",
          "val2": "-3.73",
          "chgp": "125.20%",
          "chgp_class": "positive"
        },
        {
          "field": "Operating Profit Margin (Excl OI)",
          "val1": "-0.05%",
          "val2": "-1.29%",
          "chgp": "1.24%",
          "chgp_class": "positive"
        }
      ]
    }
  },
  {
    "link": "half-yearly",
    "btn_text": "All Half Yearly Results",
    "header": "Half Yearly Results Snapshot (Standalone) - Sep'25",
    "rhs": [
      {
        "prefix": "Net Sales ",
        "suffix": " Growth in half year ended Sep 2025 is -0.28% vs -1.76% in Sep 2024",
        "dir": 1
      },
      {
        "prefix": "Standalone Net Profit ",
        "suffix": " Growth in half year ended Sep 2025 is 101.21% vs 1,537.25% in Sep 2024",
        "dir": -1
      }
    ],
    "table": {
      "header": [
        "Sep'25",
        "Sep'24",
        "Change(%)"
      ],
      "body": [
        {
          "field": "Net Sales",
          "val1": "843.39",
          "val2": "845.78",
          "chgp": "-0.28%",
          "chgp_class": "negative"
        },
        {
          "field": "Operating Profit (PBDIT) excl Other Income",
          "val1": "92.50",
          "val2": "46.07",
          "chgp": "100.78%",
          "chgp_class": "positive"
        },
        {
          "field": "Interest",
          "val1": "1.30",
          "val2": "1.17",
          "chgp": "11.11%",
          "chgp_class": "negative"
        },
        {
          "field": "Exceptional Items",
          "val1": "0.00",
          "val2": "2.48",
          "chgp": "-100.00%",
          "chgp_class": "negative"
        },
        {
          "field": "Standalone Net Profit",
          "val1": "71.43",
          "val2": "35.50",
          "chgp": "101.21%",
          "chgp_class": "positive"
        },
        {
          "field": "Operating Profit Margin (Excl OI)",
          "val1": "10.97%",
          "val2": "5.45%",
          "chgp": "5.52%",
          "chgp_class": "positive"
        }
      ]
    }
  },
  {
    "link": "nine-monthly",
    "btn_text": "All Nine Monthly Results",
    "header": "Nine Monthly Results Snapshot (Standalone) - Dec'25",
    "rhs": [
      {
        "prefix": "Net Sales ",
        "suffix": "YoY Growth in nine months ended Dec 2025 is 1.08% vs -0.73% in Dec 2024",
        "dir": 1
      },
      {
        "prefix": "Standalone Net Profit ",
        "suffix": "YoY Growth in nine months ended Dec 2025 is 55.31% vs 4,381.82% in Dec 2024",
        "dir": -1
      }
    ],
    "table": {
      "header": [
        "Dec'25",
        "Dec'24",
        "Change(%)"
      ],
      "body": [
        {
          "field": "Net Sales",
          "val1": "1,271.32",
          "val2": "1,257.72",
          "chgp": "1.08%",
          "chgp_class": "positive"
        },
        {
          "field": "Operating Profit (PBDIT) excl Other Income",
          "val1": "114.66",
          "val2": "74.40",
          "chgp": "54.11%",
          "chgp_class": "positive"
        },
        {
          "field": "Interest",
          "val1": "1.95",
          "val2": "1.79",
          "chgp": "8.94%",
          "chgp_class": "negative"
        },
        {
          "field": "Exceptional Items",
          "val1": "0.00",
          "val2": "2.51",
          "chgp": "-100.00%",
          "chgp_class": "negative"
        },
        {
          "field": "Standalone Net Profit",
          "val1": "87.78",
          "val2": "56.52",
          "chgp": "55.31%",
          "chgp_class": "positive"
        },
        {
          "field": "Operating Profit Margin (Excl OI)",
          "val1": "9.02%",
          "val2": "5.92%",
          "chgp": "3.10%",
          "chgp_class": "positive"
        }
      ]
    }
  },
  {
    "link": "annual",
    "btn_text": "All Annual Results",
    "header": "Annual Results Snapshot (Standalone) - Mar'26",
    "rhs": [
      {
        "prefix": "Net Sales ",
        "suffix": "YoY Growth in year ended Mar 2026 is 1.88% vs -2.02% in Mar 2025",
        "dir": 1
      },
      {
        "prefix": "Standalone Net Profit ",
        "suffix": "YoY Growth in year ended Mar 2026 is -7.96% vs 418.51% in Mar 2025",
        "dir": -1
      }
    ],
    "table": {
      "header": [
        "Mar'26",
        "Mar'25",
        "Change(%)"
      ],
      "body": [
        {
          "field": "Net Sales",
          "val1": "1,680.48",
          "val2": "1,649.53",
          "chgp": "1.88%",
          "chgp_class": "positive"
        },
        {
          "field": "Operating Profit (PBDIT) excl Other Income",
          "val1": "109.38",
          "val2": "120.19",
          "chgp": "-8.99%",
          "chgp_class": "negative"
        },
        {
          "field": "Interest",
          "val1": "2.59",
          "val2": "2.43",
          "chgp": "6.58%",
          "chgp_class": "negative"
        },
        {
          "field": "Exceptional Items",
          "val1": "0.00",
          "val2": "2.51",
          "chgp": "-100.00%",
          "chgp_class": "negative"
        },
        {
          "field": "Standalone Net Profit",
          "val1": "84.04",
          "val2": "91.31",
          "chgp": "-7.96%",
          "chgp_class": "negative"
        },
        {
          "field": "Operating Profit Margin (Excl OI)",
          "val1": "6.51%",
          "val2": "7.29%",
          "chgp": "-0.78%",
          "chgp_class": "negative"
        }
      ]
    }
  }
]

Quarterly Results Snapshot (Standalone) - Jun'26 - QoQstock-summary

Jun'26
Mar'26
Change(%)
Net Sales
453.67
409.16
10.88%
Operating Profit (PBDIT) excl Other Income
-0.23
-5.28
95.64%
Interest
0.67
0.65
3.08%
Exceptional Items
0.47
0.00
Standalone Net Profit
0.94
-3.73
125.20%
Operating Profit Margin (Excl OI)
-0.05%
-1.29%
1.24%
Values in Rs Cr.
Direction Arrows
Net Sales

QoQ Growth in quarter ended Jun 2026 is 10.88% vs -4.39% in Mar 2026

Direction Arrows
Standalone Net Profit

QoQ Growth in quarter ended Jun 2026 is 125.20% vs -122.81% in Mar 2026

Half Yearly Results Snapshot (Standalone) - Sep'25stock-summary

Sep'25
Sep'24
Change(%)
Net Sales
843.39
845.78
-0.28%
Operating Profit (PBDIT) excl Other Income
92.50
46.07
100.78%
Interest
1.30
1.17
11.11%
Exceptional Items
0.00
2.48
-100.00%
Standalone Net Profit
71.43
35.50
101.21%
Operating Profit Margin (Excl OI)
10.97%
5.45%
5.52%
Values in Rs Cr.
Direction Arrows
Net Sales

Growth in half year ended Sep 2025 is -0.28% vs -1.76% in Sep 2024

Direction Arrows
Standalone Net Profit

Growth in half year ended Sep 2025 is 101.21% vs 1,537.25% in Sep 2024

Nine Monthly Results Snapshot (Standalone) - Dec'25stock-summary

Dec'25
Dec'24
Change(%)
Net Sales
1,271.32
1,257.72
1.08%
Operating Profit (PBDIT) excl Other Income
114.66
74.40
54.11%
Interest
1.95
1.79
8.94%
Exceptional Items
0.00
2.51
-100.00%
Standalone Net Profit
87.78
56.52
55.31%
Operating Profit Margin (Excl OI)
9.02%
5.92%
3.10%
Values in Rs Cr.
Direction Arrows
Net Sales

YoY Growth in nine months ended Dec 2025 is 1.08% vs -0.73% in Dec 2024

Direction Arrows
Standalone Net Profit

YoY Growth in nine months ended Dec 2025 is 55.31% vs 4,381.82% in Dec 2024

Annual Results Snapshot (Standalone) - Mar'26stock-summary

Mar'26
Mar'25
Change(%)
Net Sales
1,680.48
1,649.53
1.88%
Operating Profit (PBDIT) excl Other Income
109.38
120.19
-8.99%
Interest
2.59
2.43
6.58%
Exceptional Items
0.00
2.51
-100.00%
Standalone Net Profit
84.04
91.31
-7.96%
Operating Profit Margin (Excl OI)
6.51%
7.29%
-0.78%
Values in Rs Cr.
Direction Arrows
Net Sales

YoY Growth in year ended Mar 2026 is 1.88% vs -2.02% in Mar 2025

Direction Arrows
Standalone Net Profit

YoY Growth in year ended Mar 2026 is -7.96% vs 418.51% in Mar 2025

stock-summaryCompany CV
About KSE Ltd stock-summary
stock-summary
KSE Ltd
Micro Cap
FMCG
Incorporated in 1963, KSE Ltd., (formerly known as Kerala Solvent Extractions Ltd) was promoted by K L Francis, M C Paul, T O Paul and A P George. The main activities of the Company are Manufacture of ready mixed cattle feed, extraction of oil from oil cakes using solvent extraction method and processing of milk and milk products. The company came out with a public issue at a premium of Rs 20 aggregating Rs 2.43 cr in May '94, to meet part of the long-term working capital needs.
Company Coordinates stock-summary
Company Details
P B No 20, Solvent Road Irinjalakuda Kerala : 680121
stock-summary
Tel: 91-480-2825476/2826676
stock-summary
ksekerala@gmail.com
Registrar Details
SKDC Consultants Ltd , Kanapathy Towers, 3rd Floor, Ganapathy, Coimbatore