
Compare Simran Farms with Similar Stocks
Dashboard
Weak Long Term Fundamental Strength with a -21.56% CAGR growth in Operating Profits over the last 5 years
- Low ability to service debt as the company has a high Debt to EBITDA ratio of 2.96 times
- The company has been able to generate a Return on Capital Employed (avg) of 9.88% signifying low profitability per unit of total capital (equity and debt)
Below par performance in long term as well as near term
Total Returns (Price + Dividend) 
Latest dividend: 0.8000 per share ex-dividend date: Sep-20-2012
Risk Adjusted Returns v/s
Returns Beta

News
Simran Farms Ltd is Rated Sell
Simran Farms Ltd is rated 'Sell' by MarketsMOJO, with this rating last updated on 01 June 2026. However, all fundamentals, returns, and financial metrics discussed here reflect the stock’s current position as of 09 July 2026, providing investors with the most up-to-date analysis.
Read full news article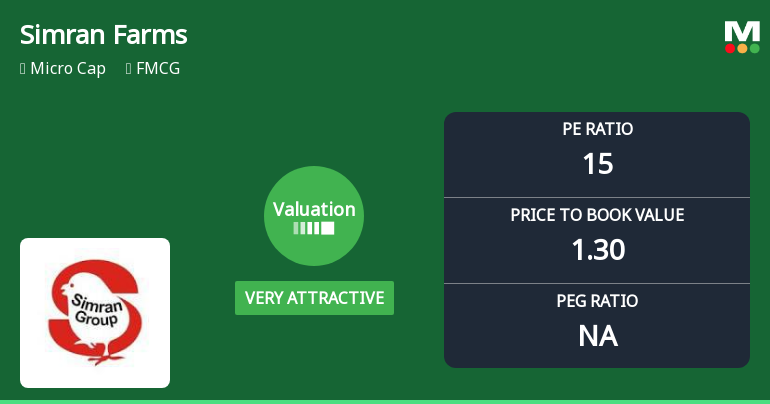
Simran Farms Ltd Valuation Shifts Signal Renewed Price Attractiveness Amid Mixed Market Returns
Simran Farms Ltd, a micro-cap player in the FMCG sector, has witnessed a notable improvement in its valuation parameters, shifting from an attractive to a very attractive rating. Despite a recent downgrade in its overall Mojo Grade to Sell from Strong Sell, the company’s price-to-earnings (P/E) and price-to-book value (P/BV) ratios suggest enhanced price appeal relative to peers and historical averages. This article analyses the valuation changes, compares them with sector benchmarks, and examines the implications for investors amid the company’s mixed market performance.
Read full news article
Simran Farms Ltd is Rated Sell by MarketsMOJO
Simran Farms Ltd is rated Sell by MarketsMOJO, with this rating last updated on 01 June 2026. However, all fundamentals, returns, and financial metrics discussed here reflect the company’s current position as of 28 June 2026, providing investors with the most up-to-date analysis.
Read full news article Announcements
Compliances-Certificate under Reg. 74 (5) of SEBI (DP) Regulations 2018
06-Jul-2026 | Source : BSEThe Company hereby submits Certificate under Reg. 74(5) of SEBI (DP) Regulations 2018 for the quarter ended 30th June 2026.
Closure of Trading Window
26-Jun-2026 | Source : BSEThe Company hereby submits intimation of closure of trading window wef 1st July 2026 for the purpose of consideration of Standalone and Consolidated Unaudited Financial results for the quarter ended 30th June 2026.
Announcement under Regulation 30 (LODR)-Newspaper Publication
02-Jun-2026 | Source : BSEThe Company hereby submits Newspaper Publication of extract of Standalone and Consolidated Audited Financial Results for Quarter and Year ended 31st March 2026.
Corporate Actions

No Upcoming Board Meetings

Simran Farms Ltd has declared 8% dividend, ex-date: 20 Sep 12

No Splits history available

No Bonus history available

No Rights history available
Quality key factors
Valuation key factors
Technicals key factors
 Technical Indicator Scale: Bearish, Mildly Bearish, Sideways, Mildly Bullish, Bullish Turned
 Shareholding Snapshot : Mar 2026
Shareholding Compare (%holding)
Non Institution
None
Held by 0 Schemes
Held by 0 FIIs
Harender Singh Bhatia (huf) (6.12%)
Ashwani Chowdhry (4.16%)
40.03%
Quarterly Results Snapshot (Consolidated) - Mar'26 - QoQ

QoQ Growth in quarter ended Mar 2026 is 6.91% vs 23.43% in Dec 2025
QoQ Growth in quarter ended Mar 2026 is 149.56% vs 222.86% in Dec 2025
Half Yearly Results Snapshot (Consolidated) - Sep'25
Growth in half year ended Sep 2025 is 12.07% vs 56.28% in Sep 2024
Growth in half year ended Sep 2025 is -87.61% vs 150.98% in Sep 2024
Nine Monthly Results Snapshot (Consolidated) - Dec'25
YoY Growth in nine months ended Dec 2025 is 5.01% vs 71.31% in Dec 2024
YoY Growth in nine months ended Dec 2025 is -75.38% vs 4,689.47% in Dec 2024
Annual Results Snapshot (Consolidated) - Mar'26
YoY Growth in year ended Mar 2026 is 4.83% vs 71.54% in Mar 2025
YoY Growth in year ended Mar 2026 is -13.95% vs 1,447.37% in Mar 2025
About Simran Farms Ltd

Company Coordinates


