
Compare DigiSpice Tech. with Similar Stocks
Dashboard
Poor Management Efficiency with a low ROE of 4.42%
- The company has been able to generate a Return on Equity (avg) of 4.42% signifying low profitability per unit of shareholders funds
The company is Net-Debt Free
Poor long term growth as Net Sales has grown by an annual rate of -8.18% over the last 5 years
The company has declared Positive results for the last 4 consecutive quarters
With ROE of 10.1, it has a Very Attractive valuation with a 2.1 Price to Book Value
Majority shareholders : Promoters
Underperformed the market in the last 1 year
Stock DNA
Computers - Software & Consulting
INR 469 Cr (Micro Cap)
21.00
22
0.00%
-1.09
10.08%
2.07
Total Returns (Price + Dividend) 
Latest dividend: 0.45 per share ex-dividend date: Sep-19-2019
Risk Adjusted Returns v/s
Returns Beta

News
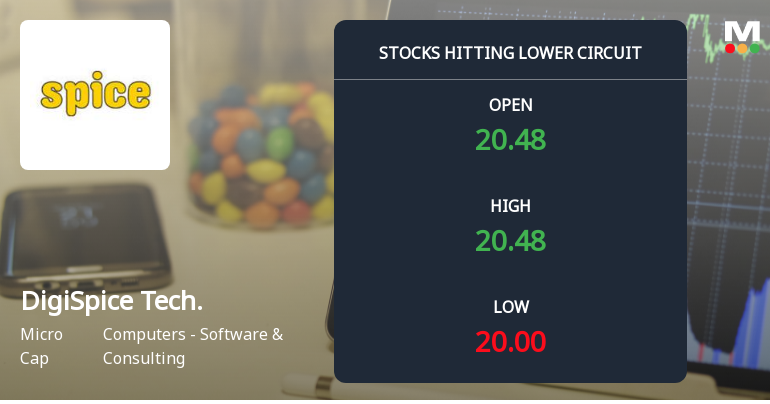
DigiSpice Technologies Ltd Locks at Lower Circuit With 5% Loss — Sellers Queue, No Buyers in Sight
At Rs 19.29, sellers were still queuing — but there were no buyers willing to take the other side. DigiSpice Technologies Ltd locked at its lower circuit of 5% on 16 Jun 2026, with unfilled sell orders and a frozen price, signalling a day dominated by selling pressure and a lack of demand.
Read full news article
DigiSpice Technologies Ltd is Rated Hold
DigiSpice Technologies Ltd is rated 'Hold' by MarketsMOJO, with this rating last updated on 15 May 2026. While the rating was revised on that date, the analysis and financial metrics presented here reflect the stock's current position as of 10 June 2026, providing investors with an up-to-date view of the company’s fundamentals, valuation, financial trends, and technical outlook.
Read full news article
DigiSpice Technologies Ltd is Rated Hold
DigiSpice Technologies Ltd is rated 'Hold' by MarketsMOJO, with this rating last updated on 15 May 2026. While the rating change occurred on that date, the analysis and financial metrics discussed here reflect the stock's current position as of 29 May 2026, providing investors with the most up-to-date view of the company’s fundamentals and market performance.
Read full news article Announcements
Announcement under Regulation 30 (LODR)-Newspaper Publication
11-Jun-2026 | Source : BSEPlease find attached herewith copy of newspaper publication.
Letter To Shareholders - Notice Of Meeting Of The Equity Shareholders
10-Jun-2026 | Source : BSELetter to Shareholder - Notice of meeting of the Equity Shareholders
Shareholders Meeting Through VC As Per Direction Of Honble NCLT Principal Bench New Delhi
10-Jun-2026 | Source : BSEPlease find attached herewith notice of the meeting of shareholders of the Company scheduled to be held on July 13 2026 at 11:00 A.M. (IST)
Corporate Actions

No Upcoming Board Meetings

DigiSpice Technologies Ltd has declared 15% dividend, ex-date: 19 Sep 19

No Splits history available

No Bonus history available

DigiSpice Technologies Ltd has announced 1:1 rights issue, ex-date: 24 Nov 06
Quality key factors
Valuation key factors
Technicals key factors
 Technical Indicator Scale: Bearish, Mildly Bearish, Sideways, Mildly Bullish, Bullish Turned
 Shareholding Snapshot : Mar 2026
Shareholding Compare (%holding)
Promoters
None
Held by 0 Schemes
Held by 1 FIIs (0.0%)
Spice Connect Private Limited (72.27%)
Mediatek India Technology Private Limited (1.62%)
13.21%
Quarterly Results Snapshot (Consolidated) - Mar'26 - YoY

YoY Growth in quarter ended Mar 2026 is -8.25% vs 10.10% in Mar 2025

YoY Growth in quarter ended Mar 2026 is 121.88% vs -133.10% in Mar 2025
Half Yearly Results Snapshot (Consolidated) - Sep'25
Growth in half year ended Sep 2025 is 13.56% vs -2.00% in Sep 2024
Growth in half year ended Sep 2025 is 293.07% vs 70.54% in Sep 2024
Nine Monthly Results Snapshot (Consolidated) - Dec'25
YoY Growth in nine months ended Dec 2025 is 7.78% vs -0.50% in Dec 2024
YoY Growth in nine months ended Dec 2025 is 160.75% vs -4.65% in Dec 2024
Annual Results Snapshot (Consolidated) - Mar'26
YoY Growth in year ended Mar 2026 is 3.61% vs 2.06% in Mar 2025
YoY Growth in year ended Mar 2026 is 148.47% vs -435.39% in Mar 2025
About DigiSpice Technologies Ltd

Company Coordinates


