
Compare Bhagwati Auto with Similar Stocks
Dashboard
Healthy long term growth as Operating profit has grown by an annual rate 48.01%
The company has declared Positive results for the last 4 consecutive quarters
With ROE of 22.1, it has a Very Attractive valuation with a 2.5 Price to Book Value
Majority shareholders : Promoters
Market Beating Performance
Stock DNA
Auto Components & Equipments
INR 151 Cr (Micro Cap)
11.00
49
0.48%
-0.01
22.10%
2.56
Total Returns (Price + Dividend) 
Latest dividend: 2.5 per share ex-dividend date: Sep-09-2025
Risk Adjusted Returns v/s
Returns Beta

News
Bhagwati Autocast Ltd is Rated Hold by MarketsMOJO
Bhagwati Autocast Ltd is rated 'Hold' by MarketsMOJO, with this rating last updated on 04 June 2026. However, the analysis and financial metrics discussed here reflect the company’s current position as of 15 June 2026, providing investors with an up-to-date view of its fundamentals, returns, and market standing.
Read full news article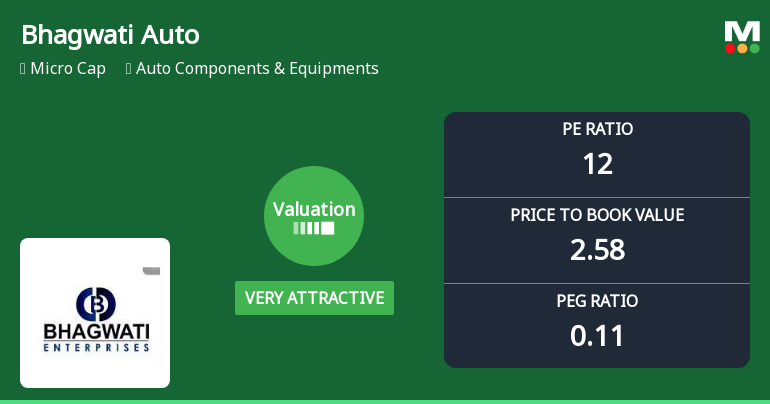
Bhagwati Autocast Ltd Valuation Shifts Signal Renewed Price Attractiveness
Bhagwati Autocast Ltd has witnessed a notable shift in its valuation parameters, moving from an already attractive position to a very attractive one. This change is underscored by a significant improvement in key metrics such as the price-to-earnings (P/E) ratio and price-to-book value (P/BV), positioning the micro-cap auto components player favourably against its peers and historical benchmarks.
Read full news article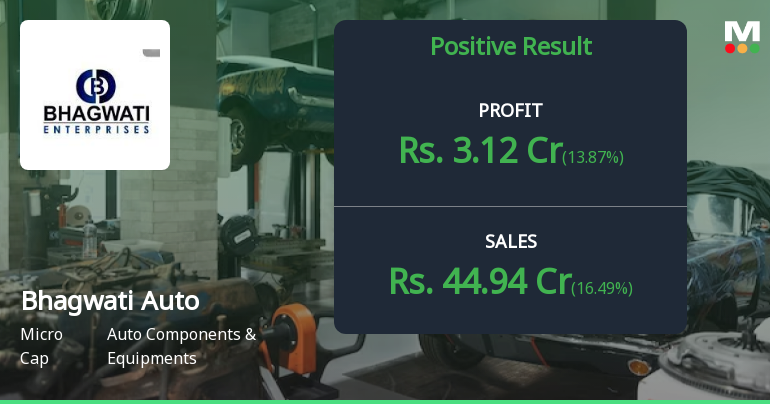
Bhagwati Autocast Q4 FY26: Margin Compression Clouds Strong Revenue Growth
Bhagwati Autocast Ltd., a Gujarat-based manufacturer of specialised cast iron and spheroidal graphite iron castings, reported mixed results for Q4 FY26, with net profit declining 11.86% quarter-on-quarter to ₹3.12 crores despite revenue reaching a record ₹44.94 crores. The micro-cap company, with a market capitalisation of ₹171.00 crores, saw its stock retreat 2.35% to ₹560.05 following the results announcement, reflecting investor concerns over margin compression that offset the positive revenue momentum.
Read full news article Announcements
Announcement under Regulation 30 (LODR)-Newspaper Publication
06-Jun-2026 | Source : BSENewspaper Advertisement in compliances with the IEPF
Announcement under Regulation 30 (LODR)-Resignation of Company Secretary / Compliance Officer
31-May-2026 | Source : BSEAnnouncement under Regulation 30 (LODR)-Resignation of company Secretary and Compliance Officer
Re-Appointment Of M/S. Kiran J. Mehta & Co. Cost Accountants As A Cost Auditor Of The Company For The Financial Year 2026-27
30-May-2026 | Source : BSERe-appointment of M/s. Kiran J. Mehta & Co. Cost Accountants as a Cost Auditor of the company for the F.Y 2026-27
Corporate Actions

No Upcoming Board Meetings

Bhagwati Autocast Ltd has declared 25% dividend, ex-date: 09 Sep 25

No Splits history available

No Bonus history available

No Rights history available
Quality key factors
Valuation key factors
Technicals key factors
 Technical Indicator Scale: Bearish, Mildly Bearish, Sideways, Mildly Bullish, Bullish Turned
 Shareholding Snapshot : Mar 2026
Shareholding Compare (%holding)
Promoters
None
Held by 0 Schemes
Held by 0 FIIs
Reena Pravinbhai Bhagwati (41.85%)
Mahendra Girdharilal (1.06%)
19.56%
Quarterly Results Snapshot (Standalone) - Mar'26 - YoY

YoY Growth in quarter ended Mar 2026 is 16.49% vs 19.81% in Mar 2025

YoY Growth in quarter ended Mar 2026 is 13.87% vs -32.68% in Mar 2025
Half Yearly Results Snapshot (Standalone) - Sep'25
Growth in half year ended Sep 2025 is 19.67% vs -10.23% in Sep 2024
Growth in half year ended Sep 2025 is 215.92% vs -29.47% in Sep 2024
Nine Monthly Results Snapshot (Standalone) - Dec'25
YoY Growth in nine months ended Dec 2025 is 24.61% vs -0.69% in Dec 2024
YoY Growth in nine months ended Dec 2025 is 189.18% vs 19.58% in Dec 2024
Annual Results Snapshot (Standalone) - Mar'26
YoY Growth in year ended Mar 2026 is 22.37% vs 4.21% in Mar 2025
YoY Growth in year ended Mar 2026 is 111.20% vs -11.11% in Mar 2025
About Bhagwati Autocast Ltd

Company Coordinates


