
Compare Inventure Grow. with Similar Stocks
Dashboard
With a Operating Losses, the company has a Weak Long Term Fundamental Strength
- Poor long term growth as Operating profit has grown by an annual rate of -18.12%
- PAT(Q) At Rs -5.96 cr has Fallen at -441.2% (vs previous 4Q average)
- NET SALES(Q) Lowest at Rs 10.61 cr
- PBDIT(Q) Lowest at Rs -7.77 cr.
Total Returns (Price + Dividend) 
Latest dividend: 0.019232000000000003 per share ex-dividend date: Sep-19-2019
Risk Adjusted Returns v/s
Returns Beta

News

Inventure Growth & Securities Ltd is Rated Strong Sell
Inventure Growth & Securities Ltd is rated Strong Sell by MarketsMOJO, with this rating last updated on 08 May 2026. However, the analysis and financial metrics discussed here reflect the company’s current position as of 16 June 2026, providing investors with the latest insights into its performance and outlook.
Read full news article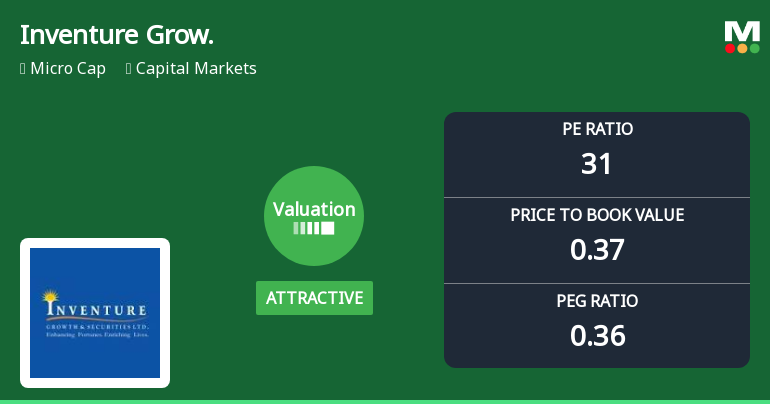
Inventure Growth & Securities Ltd Valuation Shifts Signal Renewed Price Attractiveness
Inventure Growth & Securities Ltd, a micro-cap player in the capital markets sector, has seen a notable shift in its valuation parameters, moving from fair to attractive territory. Despite a challenging market backdrop and a significant underperformance relative to the Sensex over multiple time horizons, the company’s price-to-earnings (P/E) and price-to-book value (P/BV) ratios suggest a potential re-rating opportunity for value-focused investors.
Read full news article
Inventure Growth & Securities Ltd is Rated Strong Sell
Inventure Growth & Securities Ltd is rated Strong Sell by MarketsMOJO. This rating was last updated on 08 May 2026, reflecting a reassessment of the stock’s outlook. However, all fundamentals, returns, and financial metrics discussed here are current as of 27 May 2026, providing investors with the latest view of the company’s position.
Read full news article Announcements
Intimation Under Regulation 30 Of SEBI (LODR) Regulations 2015 - Clarification Regarding Fraudulent Activities/Misuse Of CompanyS Name And Lodging Of Criminal Complaint With Police Authorities.
16-Jun-2026 | Source : BSEAs per attachment
Announcement under Regulation 30 (LODR)-Newspaper Publication
11-May-2026 | Source : BSEAs Per Attachment
Disclosure Under Regulation 30 Of The Securities And Exchange Board Of India (Listing Obligations And Disclosure Requirements) Regulations 2015.
11-May-2026 | Source : BSEAs per Attachment
Corporate Actions

No Upcoming Board Meetings

Inventure Growth & Securities Ltd has declared 2% dividend, ex-date: 19 Sep 19

Inventure Growth & Securities Ltd has announced 1:10 stock split, ex-date: 24 Jun 21

Inventure Growth & Securities Ltd has announced 3:1 bonus issue, ex-date: 22 May 12

Inventure Growth & Securities Ltd has announced 1:4 rights issue, ex-date: 05 Jul 24
Quality key factors
Valuation key factors
Technicals key factors
 Technical Indicator Scale: Bearish, Mildly Bearish, Sideways, Mildly Bullish, Bullish Turned
 Shareholding Snapshot : Mar 2026
Shareholding Compare (%holding)
Non Institution
None
Held by 0 Schemes
Held by 0 FIIs
Kanji Bachubhai Rita (26.39%)
Mohta Sarita (1.32%)
69.58%
Quarterly Results Snapshot (Consolidated) - Mar'26 - QoQ

QoQ Growth in quarter ended Mar 2026 is -18.57% vs -1.44% in Dec 2025
QoQ Growth in quarter ended Mar 2026 is -273.38% vs 285.00% in Dec 2025
Half Yearly Results Snapshot (Consolidated) - Sep'25

Growth in half year ended Sep 2025 is -23.05% vs -38.75% in Sep 2024
Growth in half year ended Sep 2025 is 41.44% vs 85.41% in Sep 2024
Nine Monthly Results Snapshot (Consolidated) - Dec'25
YoY Growth in nine months ended Dec 2025 is -13.68% vs -36.18% in Dec 2024
YoY Growth in nine months ended Dec 2025 is 112.24% vs -13.23% in Dec 2024
Annual Results Snapshot (Consolidated) - Mar'26
YoY Growth in year ended Mar 2026 is -22.59% vs 1.62% in Mar 2025
YoY Growth in year ended Mar 2026 is 88.73% vs -82.96% in Mar 2025
About Inventure Growth & Securities Ltd

Company Coordinates


