
Compare 3B Blackbio with Similar Stocks
Dashboard
Poor long term growth as Net Sales has grown by an annual rate of -8.95% and Operating profit at -19.12% over the last 5 years
With ROE of 18.1, it has a Very Expensive valuation with a 3.1 Price to Book Value
Despite the size of the company, domestic mutual funds hold only 0% of the company
Underperformed the market in the last 1 year
Stock DNA
Healthcare Services
INR 1,036 Cr (Micro Cap)
17.00
29
0.33%
-0.30
18.06%
3.20
Total Returns (Price + Dividend) 
Latest dividend: 4 per share ex-dividend date: Sep-19-2025
Risk Adjusted Returns v/s
Returns Beta

News

3B Blackbio DX Ltd is Rated Sell by MarketsMOJO
3B Blackbio DX Ltd is rated 'Sell' by MarketsMOJO, with this rating last updated on 23 March 2026. However, the analysis and financial metrics discussed here reflect the stock's current position as of 20 June 2026, providing investors with an up-to-date view of its fundamentals, valuation, financial trend, and technical outlook.
Read full news article
3B Blackbio DX Ltd Faces Bearish Momentum Amid Technical Downgrade
3B Blackbio DX Ltd, a micro-cap player in the healthcare services sector, has experienced a notable shift in its technical momentum, prompting a downgrade in its Mojo Grade from Hold to Sell as of 23 March 2026. The stock’s recent price action and technical indicators suggest increasing bearish pressure, with the share price declining by 4.8% on 18 June 2026 to ₹1,204.05 from the previous close of ₹1,264.80.
Read full news article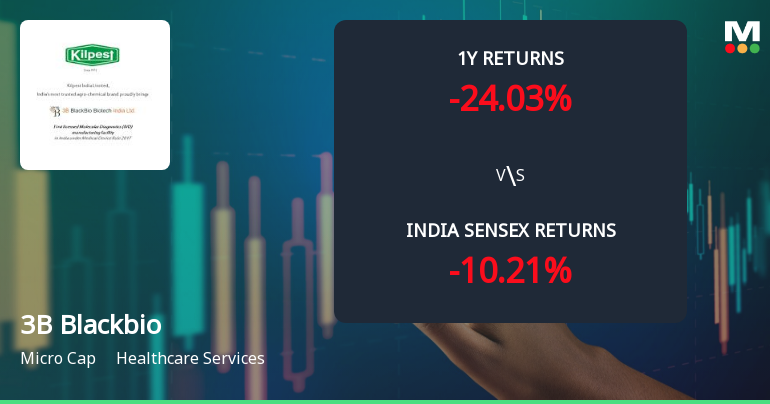
3B Blackbio DX Ltd Technical Momentum Shifts Amid Mixed Market Signals
3B Blackbio DX Ltd, a micro-cap player in the Healthcare Services sector, has recently experienced a subtle shift in its technical momentum, moving from a bearish stance to a mildly bearish outlook. Despite a notable 4.00% gain on 11 Jun 2026, the stock’s technical indicators present a complex picture, reflecting mixed signals across various timeframes and metrics.
Read full news article Announcements
Announcement under Regulation 30 (LODR)-Analyst / Investor Meet - Outcome
03-Jun-2026 | Source : BSETranscript of Analysts/Investors Call pertaining to the Financial Results for the quarter and Financial Year ended March 31 2026
Announcement under Regulation 30 (LODR)-Analyst / Investor Meet - Outcome
01-Jun-2026 | Source : BSEAudio Recording of Analysts/Investors Call pertaining to the Audited Financial Results for the quarter and financial year ended March 31 2026
Announcement under Regulation 30 (LODR)-Newspaper Publication
30-May-2026 | Source : BSESubmission of Newspaper Publication
Corporate Actions

No Upcoming Board Meetings

3B Blackbio DX Ltd has declared 40% dividend, ex-date: 19 Sep 25

No Splits history available

No Bonus history available

No Rights history available
Quality key factors
Valuation key factors
Technicals key factors
 Technical Indicator Scale: Bearish, Mildly Bearish, Sideways, Mildly Bullish, Bullish Turned
 Shareholding Snapshot : Mar 2026
Shareholding Compare (%holding)
Non Institution
None
Held by 2 Schemes (0.0%)
Held by 3 FIIs (2.57%)
Mithla Dubey (12.35%)
Rashi Daga (5.53%)
37.74%
Quarterly Results Snapshot (Consolidated) - Mar'26 - YoY

YoY Growth in quarter ended Mar 2026 is 57.47% vs -2.17% in Mar 2025
YoY Growth in quarter ended Mar 2026 is 13.81% vs -5.30% in Mar 2025
Half Yearly Results Snapshot (Consolidated) - Sep'25

Growth in half year ended Sep 2025 is 15.56% vs 45.19% in Sep 2024
Growth in half year ended Sep 2025 is 5.94% vs 70.21% in Sep 2024
Nine Monthly Results Snapshot (Consolidated) - Dec'25
YoY Growth in nine months ended Dec 2025 is 43.96% vs 44.67% in Dec 2024
YoY Growth in nine months ended Dec 2025 is 25.17% vs 64.17% in Dec 2024
Annual Results Snapshot (Consolidated) - Mar'26
YoY Growth in year ended Mar 2026 is 47.11% vs 30.15% in Mar 2025
YoY Growth in year ended Mar 2026 is 22.96% vs 45.59% in Mar 2025
About 3B Blackbio DX Ltd

Company Coordinates


