
Compare Siyaram Silk with Similar Stocks
Dashboard
Strong ability to service debt as the company has a low Debt to EBITDA ratio of 1.06 times
Healthy long term growth as Operating profit has grown by an annual rate 65.26%
With ROE of 15.8, it has a Attractive valuation with a 2 Price to Book Value
Despite the size of the company, domestic mutual funds hold only 0% of the company
Stock DNA
Garments & Apparels
INR 2,934 Cr (Small Cap)
12.00
43
2.52%
0.09
15.81%
1.97
Total Returns (Price + Dividend) 
Latest dividend: 4 per share ex-dividend date: May-25-2026
Risk Adjusted Returns v/s
Returns Beta

News

Siyaram Silk Mills Ltd Upgraded to Hold on Technical and Financial Improvements
Siyaram Silk Mills Ltd, a small-cap player in the garments and apparels sector, has seen its investment rating upgraded from Sell to Hold as of 24 June 2026. This change reflects a nuanced improvement across technical indicators, valuation metrics, financial trends, and overall quality parameters, signalling a more balanced outlook for investors amid mixed market signals.
Read full news article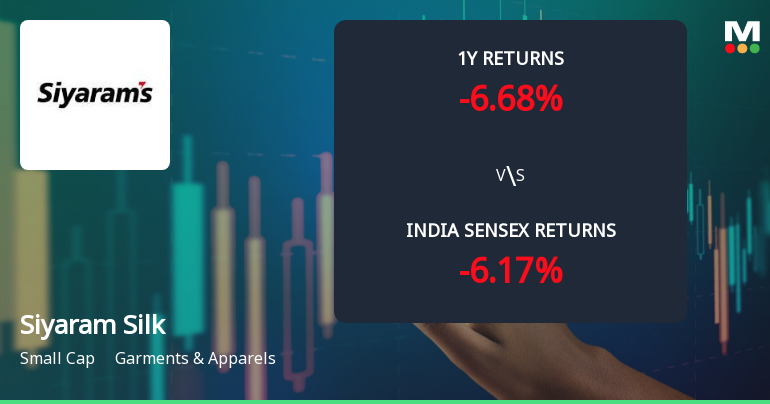
Siyaram Silk Mills Ltd Sees Technical Momentum Shift Amid Mixed Market Signals
Siyaram Silk Mills Ltd has exhibited a notable shift in its technical momentum, moving from a mildly bearish stance to a more sideways trend, reflecting a phase of consolidation. Recent technical indicators present a mixed picture, with weekly signals showing bullish tendencies while monthly metrics remain cautious, underscoring the nuanced outlook for this small-cap garment and apparel stock.
Read full news article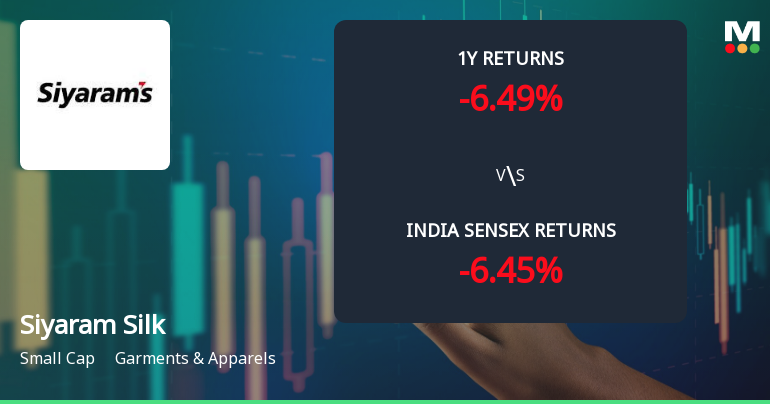
Siyaram Silk Mills Ltd Technical Analysis: Momentum Shift Signals Mildly Bearish Outlook
Siyaram Silk Mills Ltd, a small-cap player in the Garments & Apparels sector, has experienced a subtle but notable shift in its technical momentum, moving from a sideways trend to a mildly bearish stance. Despite a modest day decline of 0.57% to close at ₹627.95 on 23 Jun 2026, the stock’s technical indicators present a complex picture, with bullish signals on weekly MACD and KST contrasting with mildly bearish monthly trends and daily moving averages. This nuanced technical landscape warrants close attention from investors seeking to navigate the stock’s evolving price dynamics.
Read full news article Announcements
Disclosures under Reg. 10(6) of SEBI (SAST) Regulations 2011
12-Jun-2026 | Source : BSEThe Exchange has received the disclosure under Regulation 10(6) of SEBI (Substantial Acquisition of Shares & Takeovers) Regulations 2011 for Ramesh Kumar Poddar & Others
Disclosures under Reg. 29(2) of SEBI (SAST) Regulations 2011
11-Jun-2026 | Source : BSEThe Exchange has received the disclosure under Regulation 29(2) of SEBI (Substantial Acquisition of Shares & Takeovers) Regulations 2011 for Ankit P Poddar
Disclosures under Reg. 29(2) of SEBI (SAST) Regulations 2011
11-Jun-2026 | Source : BSEThe Exchange has received the disclosure under Regulation 29(2) of SEBI (Substantial Acquisition of Shares & Takeovers) Regulations 2011 for Rameshkumar Poddar
Corporate Actions

No Upcoming Board Meetings

Siyaram Silk Mills Ltd has declared 200% dividend, ex-date: 25 May 26

Siyaram Silk Mills Ltd has announced 2:10 stock split, ex-date: 25 Oct 17

Siyaram Silk Mills Ltd has announced 1:2 bonus issue, ex-date: 19 Oct 06

No Rights history available
Quality key factors
Valuation key factors
Technicals key factors
 Technical Indicator Scale: Bearish, Mildly Bearish, Sideways, Mildly Bullish, Bullish Turned
 Shareholding Snapshot : Mar 2026
Shareholding Compare (%holding)
Promoters
None
Held by 1 Schemes (0.0%)
Held by 63 FIIs (2.26%)
Pkp Enterprises Llp (23.81%)
Abakkus Emerging Opportunities Fund-1 (1.59%)
22.94%
Quarterly Results Snapshot (Consolidated) - Mar'26 - YoY

YoY Growth in quarter ended Mar 2026 is 15.91% vs 13.65% in Mar 2025
YoY Growth in quarter ended Mar 2026 is 35.71% vs 4.37% in Mar 2025
Half Yearly Results Snapshot (Consolidated) - Sep'25
Growth in half year ended Sep 2025 is 19.72% vs -2.79% in Sep 2024
Growth in half year ended Sep 2025 is 14.63% vs 11.78% in Sep 2024
Nine Monthly Results Snapshot (Consolidated) - Dec'25
YoY Growth in nine months ended Dec 2025 is 15.74% vs 2.85% in Dec 2024

YoY Growth in nine months ended Dec 2025 is 6.43% vs 8.08% in Dec 2024
Annual Results Snapshot (Consolidated) - Mar'26
YoY Growth in year ended Mar 2026 is 15.79% vs 6.19% in Mar 2025
YoY Growth in year ended Mar 2026 is 17.14% vs 6.70% in Mar 2025
About Siyaram Silk Mills Ltd

Company Coordinates


