
Compare A F Enterprises with Similar Stocks
Dashboard
Weak Long Term Fundamental Strength as the company has not declared results in the last 6 months
- Company's ability to service its debt is weak with a poor EBIT to Interest (avg) ratio of -2.48
- The company has reported losses. Due to this company has reported negative ROCE
Risky - No result in last 6 months
Consistent Underperformance against the benchmark over the last 3 years
Stock DNA
Trading & Distributors
INR 6 Cr (Micro Cap)
NA (Loss Making)
36
0.00%
0.10
-1.89%
0.16
Total Returns (Price + Dividend) 
A F Enterprises for the last several years.
Risk Adjusted Returns v/s
Returns Beta

News

A F Enterprises Ltd Falls to 52-Week Low of Rs 1.61 as Sell-Off Deepens
A sharp decline has pushed A F Enterprises Ltd to a fresh 52-week low of Rs 1.61 on 29 May 2026, marking a steep 63.98% drop over the past year despite some recent signs of financial improvement.
Read full news article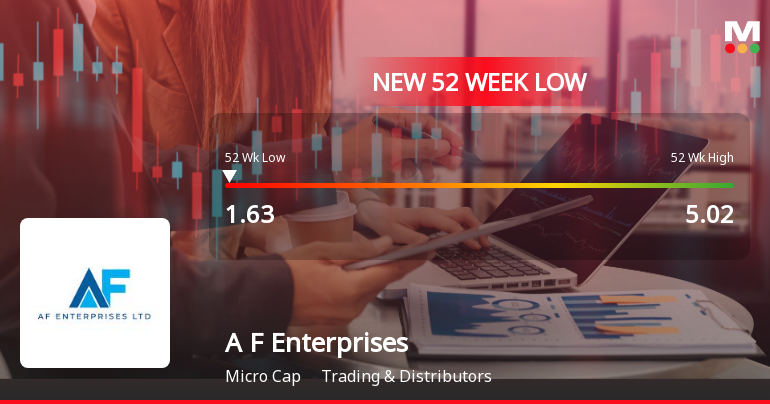
A F Enterprises Ltd Falls to 52-Week Low of Rs 1.63 as Sell-Off Deepens
A F Enterprises Ltd has slipped to a fresh 52-week low of Rs 1.63 on 27 May 2026, extending its recent downward momentum amid a broader market that remains cautious. The stock has now declined by 66.33% over the past year, significantly underperforming the Sensex, which itself is down 6.84% over the same period.
Read full news article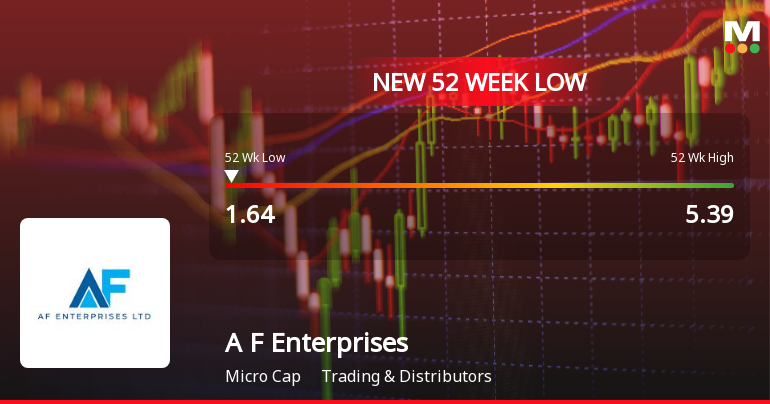
A F Enterprises Ltd Falls to 52-Week Low of Rs 1.64 as Sell-Off Deepens
For the fourth consecutive session, A F Enterprises Ltd has closed lower, culminating in a fresh 52-week low of Rs 1.64 on 22 May 2026. This marks a steep decline of 67.63% over the past year, sharply underperforming the Sensex's modest 6.61% fall during the same period.
Read full news article Announcements
Announcement under Regulation 30 (LODR)-Award_of_Order_Receipt_of_Order
19-Jun-2026 | Source : BSEPlease find enclosed herewith the disclosures under the Regulation 30 of the SEBI (Listing Obligation and Disclosure Requirement) Regulations 2015 read with the Schedule III.
Intimation Under Regulation 30 Of SEBI (Listing Obligations And Disclosure Requirements) 2015 - Update On NCLAT Proceedings
11-Jun-2025 | Source : BSEPlease find enclosed herewith Update on NCLAT Order for your reference.
Intimation Under Regulation 30 Of SEBI (Listing Obligations And Disclosure Requirements) 2015 - Intention To Appeal NCLT Order
06-May-2025 | Source : BSEPlease find enclosed herewith copy of intimation for your reference.
Corporate Actions

No Upcoming Board Meetings

No Dividend history available

No Splits history available

No Bonus history available

A F Enterprises Ltd has announced 3:2 rights issue, ex-date: 16 Aug 24
Quality key factors
Valuation key factors
Technicals key factors
 Technical Indicator Scale: Bearish, Mildly Bearish, Sideways, Mildly Bullish, Bullish Turned
 Shareholding Snapshot : Mar 2025
Shareholding Compare (%holding)
Non Institution
None
Held by 0 Schemes
Held by 0 FIIs
Rms Mosquto Private Limited (2.29%)
Kaushal Hiteshbhai Parikh (6.94%)
82.85%
Quarterly Results Snapshot (Consolidated) - Dec'24 - YoY

YoY Growth in quarter ended Dec 2024 is 370.00% vs 5.26% in Dec 2023
YoY Growth in quarter ended Dec 2024 is 6.67% vs -350.00% in Dec 2023
Half Yearly Results Snapshot (Consolidated) - Sep'24
Growth in half year ended Sep 2024 is -8.21% vs -29.86% in Sep 2023

Growth in half year ended Sep 2024 is -363.16% vs -108.56% in Sep 2023
Nine Monthly Results Snapshot (Consolidated) - Dec'24
YoY Growth in nine months ended Dec 2024 is 135.87% vs -19.64% in Dec 2023
YoY Growth in nine months ended Dec 2024 is -200.00% vs -114.91% in Dec 2023
Annual Results Snapshot (Consolidated) - Mar'24
YoY Growth in year ended Mar 2024 is -65.01% vs -50.00% in Mar 2023
YoY Growth in year ended Mar 2024 is -100.00% vs -66.96% in Mar 2023
About A F Enterprises Ltd

Company Coordinates


