
Compare Arvind Ltd with Similar Stocks
Dashboard
Healthy long term growth as Operating profit has grown by an annual rate 32.11%
The company has declared Positive results for the last 3 consecutive quarters
With ROCE of 13.4, it has a Very Attractive valuation with a 2.8 Enterprise value to Capital Employed
High Institutional Holdings at 36.14%
Company is among the highest 1% of companies rated by MarketsMojo across all 4,000 stocks
Stock DNA
Garments & Apparels
INR 13,334 Cr (Small Cap)
32.00
25
0.72%
0.31
10.52%
3.35
Total Returns (Price + Dividend) 
Latest dividend: 3.7 per share ex-dividend date: Jul-25-2025
Risk Adjusted Returns v/s
Returns Beta

News

Arvind Ltd is Rated Strong Buy
Arvind Ltd is rated Strong Buy by MarketsMOJO, with this rating last updated on 16 April 2026. However, the analysis and financial metrics discussed here reflect the company’s current position as of 22 June 2026, providing investors with the most up-to-date insight into the stock’s performance and outlook.
Read full news article
Broad-Based Technical Strength Lifts Arvind Ltd to 52-Week High of Rs 524.35
Surging from a 52-week low of Rs 275 to a fresh peak of Rs 524.35 on 22 Jun 2026, Arvind Ltd has nearly doubled in value over the past year, outpacing the Sensex’s decline of 6.42%. This milestone caps a sustained rally fuelled by a confluence of bullish technical indicators and robust price momentum.
Read full news article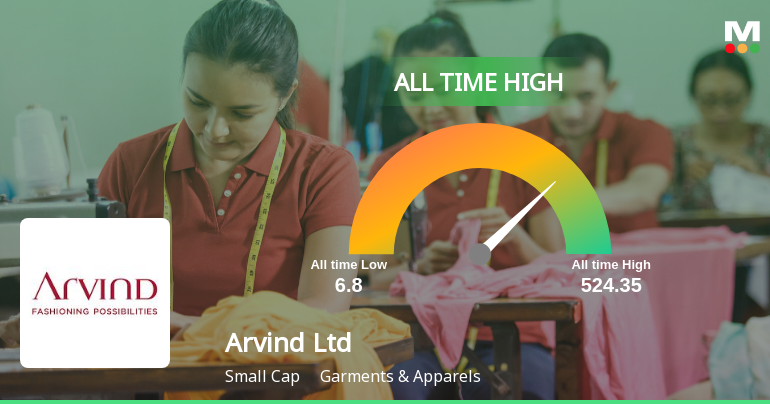
Announcements
Announcement under Regulation 30 (LODR)-Analyst / Investor Meet - Intimation
17-Jun-2026 | Source : BSESchedule of Investor Meet
Announcement under Regulation 30 (LODR)-Newspaper Publication
13-Jun-2026 | Source : BSEEnclosing copy of Newspaper Advertisement Published on today
Communication To Shareholders For KYC Updation.
09-Jun-2026 | Source : BSECommunication to Shareholders for KYC Updation.
Corporate Actions

No Upcoming Board Meetings

Arvind Ltd has declared 37% dividend, ex-date: 25 Jul 25

No Splits history available

No Bonus history available

No Rights history available
Quality key factors
Valuation key factors
Technicals key factors
 Technical Indicator Scale: Bearish, Mildly Bearish, Sideways, Mildly Bullish, Bullish Turned
 Shareholding Snapshot : Mar 2026
Shareholding Compare (%holding)
Promoters
7.2379
Held by 20 Schemes (19.62%)
Held by 134 FIIs (16.1%)
Aura Securities Private Limited (34.23%)
Quant Mutual Fund - Quant Small Cap Fund (5.65%)
16.94%
Quarterly Results Snapshot (Consolidated) - Mar'26 - QoQ

QoQ Growth in quarter ended Mar 2026 is 7.61% vs 0.06% in Dec 2025
QoQ Growth in quarter ended Mar 2026 is 63.65% vs -5.62% in Dec 2025
Half Yearly Results Snapshot (Consolidated) - Sep'25
Growth in half year ended Sep 2025 is 8.92% vs 6.46% in Sep 2024
Growth in half year ended Sep 2025 is 58.17% vs -32.12% in Sep 2024
Nine Monthly Results Snapshot (Consolidated) - Dec'25
YoY Growth in nine months ended Dec 2025 is 10.51% vs 7.86% in Dec 2024
YoY Growth in nine months ended Dec 2025 is 25.58% vs -14.79% in Dec 2024
Annual Results Snapshot (Consolidated) - Mar'26
YoY Growth in year ended Mar 2026 is 11.70% vs 7.64% in Mar 2025
YoY Growth in year ended Mar 2026 is 17.10% vs 5.01% in Mar 2025
About Arvind Ltd

Company Coordinates


