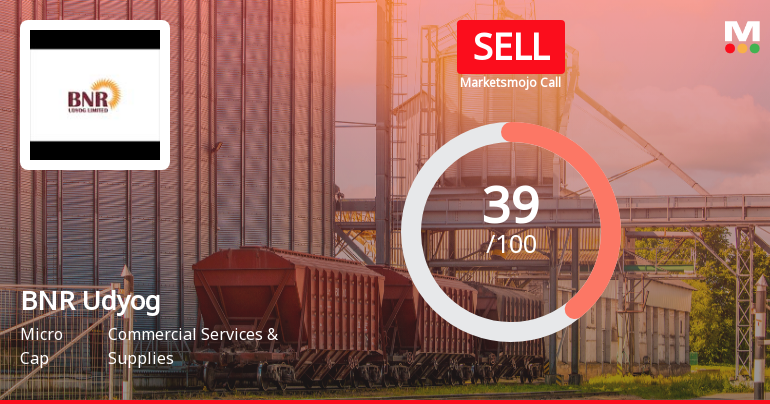
BNR Udyog

  • Market Cap: Micro Cap
  • Industry: Commercial Services & Supplies
  • ISIN: INE355C01016
  • NSEID:
  • BSEID: 530809
INR
37.06
-4.08 (-9.92%)
BSENSE

Sep 11, 03:30 PM

BSE+NSE Vol: 16.7 k

  • Price Points
  • Score
  • Mojo Parameters
  • Total Return
  • News and Corporate Actions
  • Key factors
  • Shareholding
  • Financials
  • CompanyCV
stock-summaryPrice Point
High/Low

1Day

52 Week

Valuation
Technical
Day's Volume

CASH

16.7 k (207.44%) Volume

Shareholding (Jun 2026)

FII

0.00%

Held by 0 FIIs

DII

0.00%

Held by 0 DIIs

Promoter

71.59%

Which are the latest news on BNR Udyog?

13-Sep-2026

Why is BNR Udyog Ltd falling/rising?

06-Sep-2026

As of 05-Sep, BNR Udyog Ltd's stock price is rising to Rs 38.97, supported by strong trading activity and increased investor participation. Despite a year-to-date decline of 11.89%, the stock's performance above key moving averages indicates a potential recovery phase.

As of 05-Sep, BNR Udyog Ltd's stock price is rising, currently at Rs 38.97, reflecting an increase of Rs 1.19 or 3.15%. This upward movement is supported by the stock's performance today, where it outperformed its sector by 4.38%. Additionally, the stock reached an intraday high of Rs 39.94, indicating strong trading activity. <BR><BR>Investor participation has also notably increased, with delivery volume on September 3 rising by 2896.22% compared to the 5-day average, suggesting heightened interest from investors. Furthermore, the stock's current price is above its 20-day, 50-day, 100-day, and 200-day moving averages, which typically indicates a positive trend. <BR><BR>Despite the stock's year-to-date decline of 11.89% and a significant drop of 32.04% over the past year, the recent trading activity and rising investor participation suggest a potential recovery phase, contributing to the current rise in stock price.

View full answer

Who are in the management team of BNR Udyog?

01-Sep-2026

The management team of BNR Udyog includes Kamal Rathi (Managing Director), Sandeep Rathi (Whole Time Director & CFO), and three Non-Executive Independent Directors: J Vikramdev Rao, T Bharadwaj, and M Priyadarshini, along with Sonal Agarwal (Company Secretary & Compliance Officer). They oversee the company's operations and strategic direction.

The management team of BNR Udyog includes the following individuals:<BR><BR>1. **Kamal Rathi** - Managing Director<BR>2. **Sandeep Rathi** - Whole Time Director & CFO<BR>3. **J Vikramdev Rao** - Non-Executive & Independent Director<BR>4. **T Bharadwaj** - Non-Executive & Independent Director<BR>5. **M Priyadarshini** - Non-Executive & Independent Director<BR>6. **Sonal Agarwal** - Company Secretary & Compliance Officer<BR><BR>This team plays a crucial role in overseeing the operations and strategic direction of the company.

View full answer

What does BNR Udyog do?

01-Sep-2026

BNR Udyog Ltd operates in the Commercial Services & Supplies sector, specializing in stockbroking, underwriting, merchant banking, and medical transcription. As of June 2026, it reported net sales of 0 Cr and a net profit of 1 Cr, with a market cap of INR 12 Cr.

Overview: <BR>BNR Udyog Ltd operates in the Commercial Services & Supplies industry, focusing on stockbroking, underwriting, merchant banking, and medical transcription services.<BR><BR>History: <BR>BNR Udyog Limited was incorporated on November 29, 1994. The company has been involved in various financial activities since its inception, and its medical transcription division commenced operations in August 1999. The latest quarterly results reported net sales and net profit for June 2026.<BR><BR>Financial Snapshot: <BR>Most recent Net Sales: 0 Cr (Quarterly Results - Jun 2026) <BR>Most recent Net Profit: 1 Cr (Quarterly Results - Jun 2026) <BR>Market-cap value: INR 12 Cr (Micro Cap)<BR><BR>Key Metrics: <BR>P/E: N/A <BR>Industry P/E: 25 <BR>Dividend Yield: 0.00% <BR>Debt-Equity: -0.62 <BR>Return on Equity: -2.42% <BR>Price to Book: 1.29<BR><BR>Contact Details: <BR>Address: 6-3-650 218 2nd Floor, Maheshwari Chambers Somajiguda Hyderabad Telangana : 500082 <BR>Tel: 91-040-23375791/23375793 <BR>Email: info@bnrul.com <BR>Website: http://www.bnrul.com

View full answer

Who are the peers of the BNR Udyog?

01-Sep-2026

BNR Udyog's peers include OTCO Intl, Getalong Enterprises, Tradewell Holdings, Zodiac Ventures, Pro CLB, Integrated Capital, Tarini International, Jonjua Overseas, and Befound Movement. Management risk varies from excellent to below average among peers, with OTCO Intl showing the highest 1-year return at 47.58% and Zodiac Ventures the lowest at -79.48%.

Peers: The peers of BNR Udyog are OTCO Intl, Getalong Enterp., Tradewell Hold, Zodiac Vent., Pro CLB, Integ. Capital, Tarini Internat., Jonjua Overseas, and Befound Movement.<BR><BR>Quality Snapshot: Excellent management risk is observed at Tradewell Hold and Integ. Capital, while Average management risk is found at Getalong Enterp., Zodiac Vent., Jonjua Overseas, and BNR Udyog, and the rest have Below Average management risk. For growth, Excellent growth is seen at Jonjua Overseas, Average growth is noted at Tradewell Hold and Integ. Capital, while Below Average growth is present at Getalong Enterp., Zodiac Vent., BNR Udyog, Tarini Internat., Pro CLB, OTCO Intl, and Befound Movement. In terms of capital structure, Excellent capital structure is attributed to Tradewell Hold, Pro CLB, and Integ. Capital, while Good capital structure is found at BNR Udyog and Jonjua Overseas, and the rest have Below Average capital structure.<BR><BR>Return Snapshot: The peer with the highest 1-year return is OTCO Intl at 47.58%, while the peer with the lowest is Zodiac Vent. at -79.48%. BNR Udyog's 1-year return is not available for comparison. Additionally, the peers with negative six-month returns include Zodiac Vent., Pro CLB, and Integ. Capital.

View full answer

Should I buy, sell or hold BNR Udyog Ltd?

15-Aug-2026

How big is BNR Udyog?

14-Aug-2026

Summary could not be generated.

As of 14th August, <BR><BR>Market Cap: BNR Udyog Ltd has a market capitalization of 12.00 Cr and is classified as a Micro Cap.<BR><BR>Recent Quarterly Performance: The sum of Net Sales for the latest two quarters is 2.18 Cr, while the sum of Net Profit for the same period is 0.63 Cr.<BR><BR>Balance Sheet Snapshot: The reporting period is the latest annual period, but data for Shareholder's Funds and Total Assets is unavailable.

View full answer

When is the next results date for BNR Udyog Ltd?

05-Aug-2026

The next results date for BNR Udyog Ltd is 13 August 2026.

The next results date for BNR Udyog Ltd is scheduled for 13 August 2026.

View full answer

Are BNR Udyog Ltd latest results good or bad?

11-Feb-2026

BNR Udyog Ltd's latest results are concerning, with a ROCE of -44.57% and a 34.50% decline in stock price over the past year. Despite a significant increase in net sales, the company faces severe operational challenges, leading to a "Strong Sell" rating and a negative outlook.

The latest results for BNR Udyog Ltd indicate a troubling performance. The company has reported a significant decline in key financial metrics, with a latest Return on Capital Employed (ROCE) of -44.57%, which signifies capital destruction rather than value creation. Over the past year, the stock has declined by 34.50%, underperforming the Sensex, which gained 9.01% during the same period.<BR><BR>While there was a notable increase in net sales for the quarter ended December 2025, showing a growth of 463.64% compared to the previous quarter, this is juxtaposed with a net profit that has worsened, reflecting a -200.00% change. This suggests that despite the increase in sales, the company continues to face severe operational challenges, as indicated by the negative operating profit margin.<BR><BR>Overall, BNR Udyog Ltd's financial health appears precarious, characterized by stagnant revenues, operating losses, and a lack of institutional interest. The company is currently rated as a "Strong Sell," indicating that the outlook is decidedly negative with no clear catalysts for improvement in the near term.

View full answer

How has been the historical performance of BNR Udyog?

12-Nov-2025

BNR Udyog's historical performance from 2012 to 2014 showed declining net sales and profit margins, with net sales dropping from 3.43 crore to 3.06 crore, while profit after tax decreased from 0.69 crore to 0.55 crore. However, cash flow from operating activities improved significantly during this period.

Answer:<BR>The historical performance of BNR Udyog shows a mixed trend over the years from 2012 to 2014.<BR><BR>Breakdown:<BR>BNR Udyog's net sales decreased from 3.43 crore in March 2012 to 3.06 crore in March 2014, while other operating income increased from 0.12 crore to 0.40 crore during the same period. Total operating income saw a decline from 3.55 crore in March 2012 to 3.47 crore in March 2014. Employee costs rose significantly from 1.14 crore in March 2012 to 1.79 crore in March 2014, while manufacturing expenses decreased from 1.43 crore to 0.68 crore. Total expenditure, excluding depreciation, increased slightly from 2.57 crore to 2.48 crore. Operating profit remained relatively stable, with a slight decrease from 1.06 crore in March 2012 to 1.14 crore in March 2014. Profit before tax also declined from 0.99 crore to 0.81 crore, leading to a decrease in profit after tax from 0.69 crore to 0.55 crore. The earnings per share dropped from 2.31 in March 2012 to 1.82 in March 2014. The operating profit margin and PAT margin both showed a downward trend, with the operating profit margin at 28.51% in March 2014 compared to 27.61% in March 2012, and the PAT margin decreasing from 19.5% to 15.75%. Cash flow from operating activities improved from 0.50 crore in March 2012 to 1.29 crore in March 2014, while net cash inflow turned positive at 0.32 crore in March 2014, up from a negative outflow of 0.28 crore in March 2013.

View full answer

Is BNR Udyog overvalued or undervalued?

09-Jun-2025

As of May 29, 2025, BNR Udyog is considered overvalued and risky, with a PE ratio of -16.53 and an EV to EBITDA of -8.83, indicating financial distress and poor performance compared to peers, as evidenced by a year-to-date return of -15.79% versus the Sensex's 5.63%.

As of 29 May 2025, BNR Udyog's valuation grade has moved from expensive to risky, indicating a significant shift in its perceived value. The company is currently assessed as overvalued. Key ratios reveal a PE ratio of -16.53, an EV to EBITDA of -8.83, and a ROCE of -34.64%, all of which suggest underlying financial distress.<BR><BR>In comparison to its peers, BNR Udyog's valuation stands out unfavorably; for instance, Firstsource Solutions boasts a PE ratio of 44.82 and an EV to EBITDA of 23.74, while eClerx Services maintains a PE of 32.59 and an EV to EBITDA of 21.00. These comparisons highlight BNR Udyog's challenges in generating positive earnings and cash flow. Additionally, the company's recent stock performance has lagged behind the Sensex, with a year-to-date return of -15.79% compared to the Sensex's 5.63%, reinforcing the notion that BNR Udyog is not a favorable investment at its current valuation.

View full answer

What is the technical trend for BNR Udyog?

09-Jun-2025

As of May 9, 2025, BNR Udyog's technical trend is mildly bearish, with mixed signals from MACD and KST indicators, while Bollinger Bands and moving averages reinforce the overall negative sentiment.

As of 9 May 2025, the technical trend for BNR Udyog has changed from bearish to mildly bearish. The weekly MACD indicates a mildly bullish stance, while the monthly MACD is mildly bearish, suggesting mixed signals across time frames. The Bollinger Bands are bearish on both weekly and monthly charts, and daily moving averages are also bearish, reinforcing the overall negative sentiment. The KST shows a mildly bullish trend weekly but is mildly bearish monthly, indicating potential short-term strength. The Dow Theory reflects a mildly bullish trend on the weekly chart but shows no trend on the monthly chart. Overall, the current technical stance is mildly bearish, with key indicators such as moving averages and Bollinger Bands driving this assessment.

View full answer

Who are the top shareholders of the BNR Udyog?

06-Jun-2025

The top shareholder of BNR Udyog is Kamal Narayan Rathi, who holds 57.92% of the shares, with no pledged promoter holdings. The highest public shareholder is Sangeetha S at 3.83%, while individual investors collectively own 23.06%.

The top shareholders of BNR Udyog primarily consist of promoters, with Kamal Narayan Rathi holding the largest share at 57.92%. There are no pledged promoter holdings, and the company does not have any mutual funds or foreign institutional investors (FIIs) holding shares. The highest public shareholder is Sangeetha S, who owns 3.83% of the shares. Additionally, individual investors collectively hold 23.06% of the company's shares.

View full answer

Has BNR Udyog declared dividend?

06-Jun-2025

BNR Udyog Ltd has declared a 7% dividend, amounting to 0.7000 per share, but the dividend yield is 0%. Despite recent short-term declines, total returns over longer periods have shown significant growth.

BNR Udyog Ltd has declared a 7% dividend.<BR><BR>Dividend Details:<BR>- Percentage announced: 7%<BR>- Amount per share: 0.7000<BR>- Ex-date: 01 Sep 17<BR><BR>Dividend Yield: 0%<BR><BR>Total Returns by Period:<BR>In the 6-month period, the price return was -24.66%, the dividend return was 0%, resulting in a total return of -24.66%.<BR><BR>For the 1-year period, the price return was -15.4%, the dividend return was 0%, leading to a total return of -15.4%.<BR><BR>Over the 2-year period, the price return was 39.03%, the dividend return was 0%, which resulted in a total return of 39.03%.<BR><BR>In the 3-year period, the price return was 103.33%, the dividend return was 0%, culminating in a total return of 103.33%.<BR><BR>For the 4-year period, the price return was 351.19%, the dividend return was 0%, resulting in a total return of 351.19%.<BR><BR>Lastly, in the 5-year period, the price return was 191.01%, the dividend return was 0%, leading to a total return of 191.01%.<BR><BR>Overall, while BNR Udyog has declared a dividend, the dividend yield remains at 0%, indicating that the dividend has not contributed to returns in recent periods. The total returns show significant variability, with strong performance over longer periods despite recent declines in shorter terms.

View full answer
iScoreScore
Click here to find our call on this stock
Strong Sell
Sell
Hold
Buy
Strong Buy

Dashboard

1

Weak Long Term Fundamental Strength with a -191.75% CAGR growth in Operating Profits over the last 5 years

  • Company's ability to service its debt is weak with a poor EBIT to Interest (avg) ratio of 0.44
2

Risky - Negative EBITDA

3

Below par performance in long term as well as near term

stock-summaryMojo Parameters

Mojo Parameters

Loading Valuation Snapshot...

Stock DNA

stock-summary
Industry

Commercial Services & Supplies

stock-summary
Market cap

INR 12 Cr (Micro Cap)

stock-summary
P/E

NA (Loss Making)

stock-summary
Industry P/E

24

stock-summary
Dividend Yield

0.00%

stock-summary
Debt Equity

-0.62

stock-summary
Return on Equity

-2.42%

stock-summary
Price to Book

1.36

Revenue and Profits:
Net Sales:
0 Cr
(Quarterly Results - Jun 2026)
Net Profit:
1 Cr
stock-summaryTotal Returns
Total Returns (Price + Dividend) stock-summary
Dividend Yield (0%)
TimePeriod
Price Return
Dividend Return
Total Return
3 Months
1.67%
0%
1.67%
6 Months
-2.19%
0%
-2.19%
1 Year
-31.65%
0%
-31.65%
2 Years
-55.11%
0%
-55.11%
3 Years
-13.69%
0%
-13.69%
4 Years
78.6%
0%
78.6%
5 Years
121.92%
0%
121.92%

Latest dividend: 0.7000 per share ex-dividend date: Sep-01-2017

Risk Adjusted Returns v/s stock-summary
Returns Beta
Icon
Beta has not been calculated since enough price history is not available
stock-summaryNews & Corporate Actions

Announcements stock-summary

Board Meeting Outcome for Outcome Of Board Meeting

13-Aug-2026 | Source : BSE

Outcome of Board Meeting held on 13th August 2026.

Unaudited Financial Results For The Quarter Ended 30.06.2026.

13-Aug-2026 | Source : BSE

Unaudited Financial Results for the quarter ended 30.06.2026.

Board Meeting Intimation for Meeting Proposed To Be Held On 13Th August 2026.

04-Aug-2026 | Source : BSE

BNR Udyog Ltdhas informed BSE that the meeting of the Board of Directors of the Company is scheduled on 13/08/2026 inter alia to consider and approve 1. Un-audited Financial Results for the quarter ended 30.06.2026. 2. Limited Review Report for the quarter ended 30.06.2026. 3. Any other business with the permission of the Chair.

Corporate Actions stock-summary

stock-summary
BOARD MEETING

No Upcoming Board Meetings

stock-summary
DIVIDEND

BNR Udyog Ltd has declared 7% dividend, ex-date: 01 Sep 17

stock-summary
SPLITS

No Splits history available

stock-summary
BONUS

No Bonus history available

stock-summary
RIGHTS

No Rights history available

stock-summaryKey Factors

Quality key factors stock-summary

Factor
Value
Sales Growth (5y)
-2.77%
EBIT Growth (5y)
-191.75%
EBIT to Interest (avg)
0.44
Debt to EBITDA (avg)
Net Debt is too low
Net Debt to Equity (avg)
-0.62
Sales to Capital Employed (avg)
0.33
Tax Ratio
57.69%
Dividend Payout Ratio
0
Pledged Shares
0
Institutional Holding
0
ROCE (avg)
3.68%
ROE (avg)
16.74%

Valuation key factors

Factor
Value
P/E Ratio
NA (Loss Making)
Industry P/E
24
Price to Book Value
1.24
EV to EBIT
-5.65
EV to EBITDA
-5.65
EV to Capital Employed
1.64
EV to Sales
3.16
PEG Ratio
NA
Dividend Yield
NA
ROCE (Latest)
-33.91%
ROE (Latest)
-2.42%

Technicals key factors

Indicator
Weekly
Monthly
MACD
Bullish
Bearish
RSI
Bearish
No Signal
Bollinger Bands
Mildly Bullish
Bearish
Moving Averages
Bullish (Daily)
KST
Bullish
Bearish
Dow Theory
Mildly Bullish
Mildly Bullish
stock-summary Technical Indicator Scale: Bearish, Mildly Bearish, Sideways, Mildly Bullish, Bullish  Turned 
stock-summaryShareholding
Shareholding Snapshot : Jun 2026stock-summary
Shareholding Compare (%holding) stock-summary
Majority shareholders

Promoters

Pledged Promoter Holdings

None

Mutual Funds

Held by 0 Schemes

FIIs

Held by 0 FIIs

Promoter with highest holding

Kamal Narayan Rathi (57.92%)

Highest Public shareholder

Sangeetha S (3.83%)

Individual Investors Holdings

22.83%

stock-summaryFinancial
[
  {
    "link": "quarterly",
    "btn_text": "All Quarterly Results",
    "header": "Quarterly Results Snapshot (Standalone) - Jun'26 - QoQ",
    "rhs": [
      {
        "prefix": "Net Sales ",
        "suffix": "QoQ Growth in quarter ended Jun 2026 is 288.89% vs -85.48% in Mar 2026",
        "dir": 1
      },
      {
        "prefix": "Standalone Net Profit ",
        "suffix": "QoQ Growth in quarter ended Jun 2026 is 220.41% vs -104.17% in Mar 2026",
        "dir": 1
      }
    ],
    "table": {
      "header": [
        "Jun'26",
        "Mar'26",
        "Change(%)"
      ],
      "body": [
        {
          "field": "Net Sales",
          "val1": "0.35",
          "val2": "0.09",
          "chgp": "288.89%",
          "chgp_class": "positive"
        },
        {
          "field": "Operating Profit (PBDIT) excl Other Income",
          "val1": "0.59",
          "val2": "-0.79",
          "chgp": "174.68%",
          "chgp_class": "positive"
        },
        {
          "field": "Interest",
          "val1": "0.00",
          "val2": "0.00",
          "chgp": "",
          "chgp_class": "neutral"
        },
        {
          "field": "Exceptional Items",
          "val1": "0.00",
          "val2": "0.00",
          "chgp": "",
          "chgp_class": "neutral"
        },
        {
          "field": "Standalone Net Profit",
          "val1": "0.59",
          "val2": "-0.49",
          "chgp": "220.41%",
          "chgp_class": "positive"
        },
        {
          "field": "Operating Profit Margin (Excl OI)",
          "val1": "168.57%",
          "val2": "-877.78%",
          "chgp": "1,046.35%",
          "chgp_class": "positive"
        }
      ]
    }
  },
  {
    "link": "half-yearly",
    "btn_text": "All Half Yearly Results",
    "header": "Half Yearly Results Snapshot (Standalone) - Sep'25",
    "rhs": [
      {
        "prefix": "Net Sales ",
        "suffix": " Growth in half year ended Sep 2025 is -40.00% vs -23.91% in Sep 2024",
        "dir": -1
      },
      {
        "prefix": "Standalone Net Profit ",
        "suffix": " Growth in half year ended Sep 2025 is -58.33% vs -89.61% in Sep 2024",
        "dir": 1
      }
    ],
    "table": {
      "header": [
        "Sep'25",
        "Sep'24",
        "Change(%)"
      ],
      "body": [
        {
          "field": "Net Sales",
          "val1": "0.63",
          "val2": "1.05",
          "chgp": "-40.00%",
          "chgp_class": "negative"
        },
        {
          "field": "Operating Profit (PBDIT) excl Other Income",
          "val1": "-0.02",
          "val2": "0.51",
          "chgp": "-103.92%",
          "chgp_class": "negative"
        },
        {
          "field": "Interest",
          "val1": "0.00",
          "val2": "0.00",
          "chgp": "",
          "chgp_class": "neutral"
        },
        {
          "field": "Exceptional Items",
          "val1": "0.00",
          "val2": "0.00",
          "chgp": "",
          "chgp_class": "neutral"
        },
        {
          "field": "Standalone Net Profit",
          "val1": "0.20",
          "val2": "0.48",
          "chgp": "-58.33%",
          "chgp_class": "negative"
        },
        {
          "field": "Operating Profit Margin (Excl OI)",
          "val1": "-3.17%",
          "val2": "48.57%",
          "chgp": "-51.74%",
          "chgp_class": "negative"
        }
      ]
    }
  },
  {
    "link": "nine-monthly",
    "btn_text": "All Nine Monthly Results",
    "header": "Nine Monthly Results Snapshot (Standalone) - Dec'25",
    "rhs": [
      {
        "prefix": "Net Sales ",
        "suffix": "YoY Growth in nine months ended Dec 2025 is -22.84% vs -27.03% in Dec 2024",
        "dir": 1
      },
      {
        "prefix": "Standalone Net Profit ",
        "suffix": "YoY Growth in nine months ended Dec 2025 is 77.78% vs -103.73% in Dec 2024",
        "dir": 1
      }
    ],
    "table": {
      "header": [
        "Dec'25",
        "Dec'24",
        "Change(%)"
      ],
      "body": [
        {
          "field": "Net Sales",
          "val1": "1.25",
          "val2": "1.62",
          "chgp": "-22.84%",
          "chgp_class": "negative"
        },
        {
          "field": "Operating Profit (PBDIT) excl Other Income",
          "val1": "-0.26",
          "val2": "-0.16",
          "chgp": "-62.50%",
          "chgp_class": "negative"
        },
        {
          "field": "Interest",
          "val1": "0.00",
          "val2": "0.00",
          "chgp": "",
          "chgp_class": "neutral"
        },
        {
          "field": "Exceptional Items",
          "val1": "0.00",
          "val2": "0.00",
          "chgp": "",
          "chgp_class": "neutral"
        },
        {
          "field": "Standalone Net Profit",
          "val1": "-0.04",
          "val2": "-0.18",
          "chgp": "77.78%",
          "chgp_class": "positive"
        },
        {
          "field": "Operating Profit Margin (Excl OI)",
          "val1": "-20.80%",
          "val2": "-9.88%",
          "chgp": "-10.92%",
          "chgp_class": "negative"
        }
      ]
    }
  },
  {
    "link": "annual",
    "btn_text": "All Annual Results",
    "header": "Annual Results Snapshot (Standalone) - Mar'26",
    "rhs": [
      {
        "prefix": "Net Sales ",
        "suffix": "YoY Growth in year ended Mar 2026 is -13.55% vs -48.84% in Mar 2025",
        "dir": 1
      },
      {
        "prefix": "Standalone Net Profit ",
        "suffix": "YoY Growth in year ended Mar 2026 is 3.64% vs -112.76% in Mar 2025",
        "dir": 1
      }
    ],
    "table": {
      "header": [
        "Mar'26",
        "Mar'25",
        "Change(%)"
      ],
      "body": [
        {
          "field": "Net Sales",
          "val1": "1.34",
          "val2": "1.55",
          "chgp": "-13.55%",
          "chgp_class": "negative"
        },
        {
          "field": "Operating Profit (PBDIT) excl Other Income",
          "val1": "-1.04",
          "val2": "-1.00",
          "chgp": "-4.00%",
          "chgp_class": "negative"
        },
        {
          "field": "Interest",
          "val1": "0.00",
          "val2": "0.00",
          "chgp": "",
          "chgp_class": "neutral"
        },
        {
          "field": "Exceptional Items",
          "val1": "0.00",
          "val2": "0.00",
          "chgp": "",
          "chgp_class": "neutral"
        },
        {
          "field": "Standalone Net Profit",
          "val1": "-0.53",
          "val2": "-0.55",
          "chgp": "3.64%",
          "chgp_class": "positive"
        },
        {
          "field": "Operating Profit Margin (Excl OI)",
          "val1": "-77.61%",
          "val2": "-64.52%",
          "chgp": "-13.09%",
          "chgp_class": "negative"
        }
      ]
    }
  }
]

Quarterly Results Snapshot (Standalone) - Jun'26 - QoQstock-summary

Jun'26
Mar'26
Change(%)
Net Sales
0.35
0.09
288.89%
Operating Profit (PBDIT) excl Other Income
0.59
-0.79
174.68%
Interest
0.00
0.00
Exceptional Items
0.00
0.00
Standalone Net Profit
0.59
-0.49
220.41%
Operating Profit Margin (Excl OI)
168.57%
-877.78%
1,046.35%
Values in Rs Cr.
Direction Arrows
Net Sales

QoQ Growth in quarter ended Jun 2026 is 288.89% vs -85.48% in Mar 2026

Direction Arrows
Standalone Net Profit

QoQ Growth in quarter ended Jun 2026 is 220.41% vs -104.17% in Mar 2026

Half Yearly Results Snapshot (Standalone) - Sep'25stock-summary

Sep'25
Sep'24
Change(%)
Net Sales
0.63
1.05
-40.00%
Operating Profit (PBDIT) excl Other Income
-0.02
0.51
-103.92%
Interest
0.00
0.00
Exceptional Items
0.00
0.00
Standalone Net Profit
0.20
0.48
-58.33%
Operating Profit Margin (Excl OI)
-3.17%
48.57%
-51.74%
Values in Rs Cr.
Direction Arrows
Net Sales

Growth in half year ended Sep 2025 is -40.00% vs -23.91% in Sep 2024

Direction Arrows
Standalone Net Profit

Growth in half year ended Sep 2025 is -58.33% vs -89.61% in Sep 2024

Nine Monthly Results Snapshot (Standalone) - Dec'25stock-summary

Dec'25
Dec'24
Change(%)
Net Sales
1.25
1.62
-22.84%
Operating Profit (PBDIT) excl Other Income
-0.26
-0.16
-62.50%
Interest
0.00
0.00
Exceptional Items
0.00
0.00
Standalone Net Profit
-0.04
-0.18
77.78%
Operating Profit Margin (Excl OI)
-20.80%
-9.88%
-10.92%
Values in Rs Cr.
Direction Arrows
Net Sales

YoY Growth in nine months ended Dec 2025 is -22.84% vs -27.03% in Dec 2024

Direction Arrows
Standalone Net Profit

YoY Growth in nine months ended Dec 2025 is 77.78% vs -103.73% in Dec 2024

Annual Results Snapshot (Standalone) - Mar'26stock-summary

Mar'26
Mar'25
Change(%)
Net Sales
1.34
1.55
-13.55%
Operating Profit (PBDIT) excl Other Income
-1.04
-1.00
-4.00%
Interest
0.00
0.00
Exceptional Items
0.00
0.00
Standalone Net Profit
-0.53
-0.55
3.64%
Operating Profit Margin (Excl OI)
-77.61%
-64.52%
-13.09%
Values in Rs Cr.
Direction Arrows
Net Sales

YoY Growth in year ended Mar 2026 is -13.55% vs -48.84% in Mar 2025

Direction Arrows
Standalone Net Profit

YoY Growth in year ended Mar 2026 is 3.64% vs -112.76% in Mar 2025

stock-summaryCompany CV
About BNR Udyog Ltd stock-summary
stock-summary
BNR Udyog Ltd
Micro Cap
Commercial Services & Supplies
BNR Udyog Limited was incorporated on November 29, 1994, to carry on business of Stockbroking, Under writing, Merchant Banking and other Financial Activities. The Medical Transcription division of BNR UDYOG LTD was started in August 1999, and is based in Hyderabad, India. It provide high quality medical transcribing services to major health care facilities from a state-of-the-art center.
Company Coordinates stock-summary
Company Details
6-3-650 218 2nd Floor, Maheshwari Chambers Somajiguda Hyderabad Telangana : 500082
stock-summary
Tel: 91-040-23375791/23375793
stock-summary
info@bnrul.com
Registrar Details
Karvy Computershare Pvt Ltd, Plot No 17-24 , Near Image Hospital,, Reliance Cybervilae,Vithalrao Nagar,, Madhapur, Hyderabad