
Compare Zee Learn with Similar Stocks
Dashboard
High Debt company with Weak Long Term Fundamental Strength
- Poor long term growth as Net Sales has grown by an annual rate of 11.30% over the last 5 years
- High Debt Company with a Debt to Equity ratio (avg) of 5.64 times
- The company has been able to generate a Return on Equity (avg) of 9.03% signifying low profitability per unit of shareholders funds
Flat results in Mar 26
29.16% of Promoter Shares are Pledged
Stock DNA
Other Consumer Services
INR 304 Cr (Micro Cap)
17.00
173
0.00%
1.36
7.72%
1.35
Total Returns (Price + Dividend) 
Latest dividend: 0.1 per share ex-dividend date: Sep-17-2019
Risk Adjusted Returns v/s
Returns Beta

News

Zee Learn Ltd Locks at Lower Circuit With 5% Loss — Sellers Queue, No Buyers in Sight
At Rs 9.55, Zee Learn Ltd locked at its lower circuit limit of 5% on 24 Jun 2026, with sellers lined up but no buyers willing to absorb the supply. This freeze at the floor price highlights unfilled sell orders and a market unable to find demand at these levels.
Read full news article
Zee Learn Ltd Locks at Upper Circuit With 5% Gain Amid Delivery Drop and Thin Liquidity
At Rs 9.72, the buying was done — not because demand dried up, but because the exchange wouldn't let the stock go any higher. Zee Learn Ltd locked at its upper circuit of 5% on 23 Jun 2026, with buyers queuing and no sellers willing to part with shares in a session marked by subdued delivery volumes and limited liquidity.
Read full news article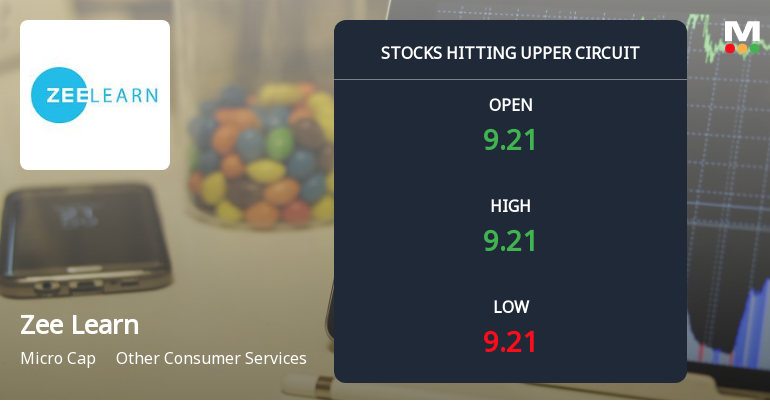
Zee Learn Ltd Locks at Upper Circuit With 4.99% Gain — Buyers Queue, Sellers Absent
At Rs 9.26, the buying was done — not because demand dried up, but because the exchange wouldn't let the stock go any higher. Zee Learn Ltd locked at its upper circuit of 4.99% on 22 Jun 2026, with buyers queuing and no sellers willing to part with shares.
Read full news article Announcements
Intimation Pursuant To Regulation 30 Of The SEBI (Listing Obligations And Disclosure Requirements) Regulations 2015
17-Jun-2026 | Source : BSEIntimation pursuant to Regulation 30 of the SEBI (Listing Obligations and Disclosure Requirements) Regulations 2015
Announcement under Regulation 30 (LODR)-Newspaper Publication
30-May-2026 | Source : BSENews Paper Publication Regarding Postal Ballot and E-voting Facility
Shareholder Meeting / Postal Ballot-Notice of Postal Ballot
29-May-2026 | Source : BSEIntimation of Postal Ballot Notice pursuant to Regulation 30 of SEBI LODR Regulation 2025
Corporate Actions

No Upcoming Board Meetings

Zee Learn Ltd has declared 10% dividend, ex-date: 17 Sep 19

No Splits history available

No Bonus history available

No Rights history available
Quality key factors
Valuation key factors
Technicals key factors
 Technical Indicator Scale: Bearish, Mildly Bearish, Sideways, Mildly Bullish, Bullish Turned
 Shareholding Snapshot : Mar 2026
Shareholding Compare (%holding)
Non Institution
29.1592
Held by 1 Schemes (0.0%)
Held by 10 FIIs (6.38%)
Essel Holdings Ltd (8.83%)
L&t Finance Limited (5.68%)
49.51%
Quarterly Results Snapshot (Consolidated) - Mar'26 - YoY

YoY Growth in quarter ended Mar 2026 is 11.40% vs 36.24% in Mar 2025

YoY Growth in quarter ended Mar 2026 is 169.24% vs -90.04% in Mar 2025
Half Yearly Results Snapshot (Consolidated) - Sep'25
Growth in half year ended Sep 2025 is 31.84% vs -19.50% in Sep 2024
Growth in half year ended Sep 2025 is -989.74% vs 94.95% in Sep 2024
Nine Monthly Results Snapshot (Consolidated) - Dec'25
YoY Growth in nine months ended Dec 2025 is 22.99% vs -11.07% in Dec 2024
YoY Growth in nine months ended Dec 2025 is -66.27% vs 37.50% in Dec 2024
Annual Results Snapshot (Consolidated) - Mar'26
YoY Growth in year ended Mar 2026 is 18.05% vs 4.40% in Mar 2025
YoY Growth in year ended Mar 2026 is 202.91% vs -92.18% in Mar 2025
About Zee Learn Ltd

Company Coordinates


