
Compare Bajaj Hindusthan with Similar Stocks
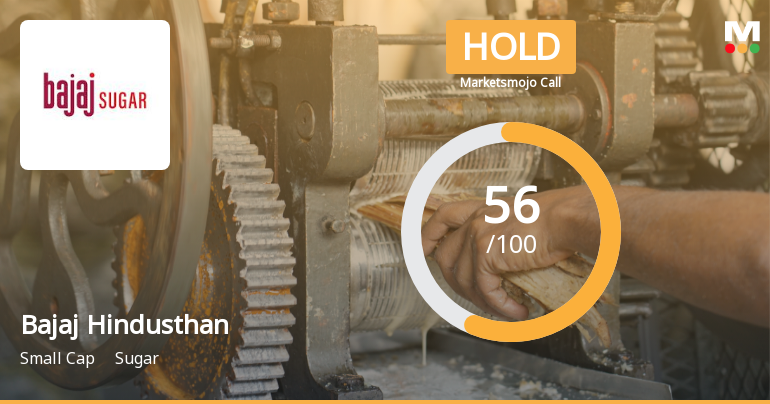
Dashboard
Weak Long Term Fundamental Strength with a -3.93% CAGR growth in Net Sales over the last 5 years
- Low ability to service debt as the company has a high Debt to EBITDA ratio of 9.70 times
- The company has been able to generate a Return on Equity (avg) of 0.74% signifying low profitability per unit of shareholders funds
With a growth in Net Profit of 77.5%, the company declared Very Positive results in Mar 26
With ROCE of 2.1, it has a Attractive valuation with a 1.1 Enterprise value to Capital Employed
100% of Promoter Shares are Pledged
Total Returns (Price + Dividend) 
Latest dividend: 0.1 per share ex-dividend date: Jan-31-2013
Risk Adjusted Returns v/s
Returns Beta

News
Bajaj Hindusthan Sugar Ltd Upgraded to Hold on Technical Improvements and Strong Quarterly Results
Bajaj Hindusthan Sugar Ltd has seen its investment rating upgraded from Sell to Hold, reflecting a notable improvement in its technical indicators and robust quarterly financial results. Despite lingering concerns over long-term fundamentals and debt levels, the company’s recent performance and valuation metrics have prompted a reassessment of its market stance.
Read full news article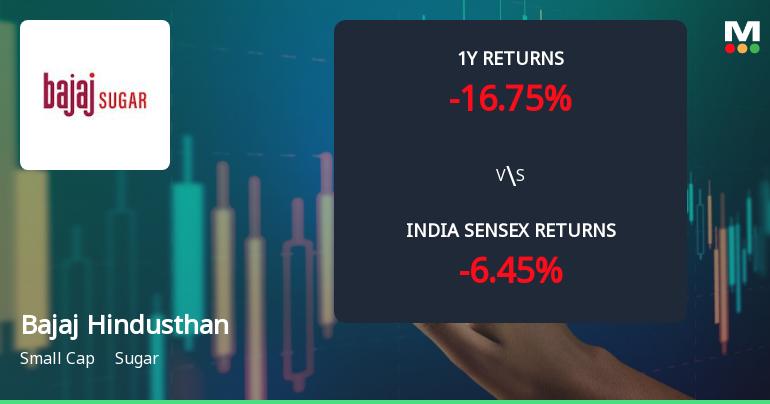
Bajaj Hindusthan Sugar Ltd Technical Momentum Shifts Amid Mixed Market Signals
Bajaj Hindusthan Sugar Ltd has recently experienced a subtle shift in its technical momentum, moving from a sideways trend to a mildly bullish stance. Despite a marginal day-on-day price decline of 0.05%, the stock’s technical indicators reveal a complex interplay of bullish and bearish signals across different timeframes, suggesting cautious optimism for investors in this small-cap sugar sector player.
Read full news article
Bajaj Hindusthan Sugar Ltd Forms Golden Cross Amid Mixed Technical Signals
The 50-day moving average for Bajaj Hindusthan Sugar Ltd has crossed above the 200-day moving average, creating a golden cross on 22 Jun 2026. Yet, the stock’s marginal decline of 0.05% on the day and conflicting monthly technical indicators suggest the signal’s reliability warrants careful examination.
Read full news article Announcements
Announcement under Regulation 30 (LODR)-Newspaper Publication
30-May-2026 | Source : BSEPursuant to Regulation 30 & 47 of the SEBI (LODR) Regulations 2015 submitting herewith Newspaper advertisement published in Navbharat Times (Hindi Daily) and The Economic Times (English Daily) on May 30 2026 in respect of the Extracts of Audited Standalone and Consolidated Financial Results for the quarter and year ended March 31 2026.
Statement Of Deviation And Variation Under Regulation 32 Of SEBI (LODR) Regulations 2015
29-May-2026 | Source : BSEPursuant to Regulation 32 of the SEBI (LODR) Regulation 2015 statement of deviation and variation for the quarter ended March 31 2026 is enclosed.
Compliances-Reg.24(A)-Annual Secretarial Compliance
29-May-2026 | Source : BSEAnnual Secretarial Compliance Report under Regulation 24A of the SEBI (LODR) Regulations 2015 for the Financial year ended March 2026.
Corporate Actions

No Upcoming Board Meetings

Bajaj Hindusthan Sugar Ltd has declared 10% dividend, ex-date: 31 Jan 13

No Splits history available

No Bonus history available

Bajaj Hindusthan Sugar Ltd has announced 2:1 rights issue, ex-date: 21 Sep 11
Quality key factors
Valuation key factors
Technicals key factors
 Technical Indicator Scale: Bearish, Mildly Bearish, Sideways, Mildly Bullish, Bullish Turned
 Shareholding Snapshot : Mar 2026
Shareholding Compare (%holding)
Non Institution
100
Held by 3 Schemes (0.0%)
Held by 40 FIIs (1.14%)
Kushagra Bajaj (4.05%)
State Bank Of India (11.59%)
30.74%
Quarterly Results Snapshot (Consolidated) - Mar'26 - YoY

YoY Growth in quarter ended Mar 2026 is 7.41% vs -16.93% in Mar 2025

YoY Growth in quarter ended Mar 2026 is 77.37% vs 142.63% in Mar 2025
Half Yearly Results Snapshot (Consolidated) - Sep'25
Growth in half year ended Sep 2025 is -5.49% vs 2.08% in Sep 2024
Growth in half year ended Sep 2025 is -96.52% vs 28.15% in Sep 2024
Nine Monthly Results Snapshot (Consolidated) - Dec'25
YoY Growth in nine months ended Dec 2025 is -5.85% vs -5.03% in Dec 2024
YoY Growth in nine months ended Dec 2025 is -8.30% vs -37.61% in Dec 2024
Annual Results Snapshot (Consolidated) - Mar'26
YoY Growth in year ended Mar 2026 is -2.15% vs -8.68% in Mar 2025
YoY Growth in year ended Mar 2026 is 637.25% vs 72.72% in Mar 2025
About Bajaj Hindusthan Sugar Ltd

Company Coordinates


