
Compare Trans India with Similar Stocks
Stock DNA
Industrial Manufacturing
INR 29 Cr (Micro Cap)
15.00
35
0.00%
0.19
2.17%
0.43
Total Returns (Price + Dividend) 
Trans India for the last several years.
Risk Adjusted Returns v/s
Returns Beta

News
Are Trans India House Impex Ltd latest results good or bad?
Trans India House Impex Ltd's latest financial results for the quarter ending March 2026 indicate a notable shift in performance metrics. The company reported a net profit of ₹1.72 crores, reflecting a substantial year-on-year growth of 551.85%, compared to a loss in the same quarter last year. Revenue also saw a significant increase, reaching ₹25.58 crores, which translates to a year-on-year growth of 148.61%. This marks a remarkable recovery from previous quarters, where revenue fluctuations were pronounced. The operating margin improved to 10.24%, the highest in seven quarters, driven by an operating profit of ₹2.62 crores. This improvement in profitability is noteworthy, especially considering the company's historical volatility in earnings. However, the revenue growth has been characterized by extreme variability, with sequential changes ranging from significant declines to sharp increases, suggesting...
Read full news article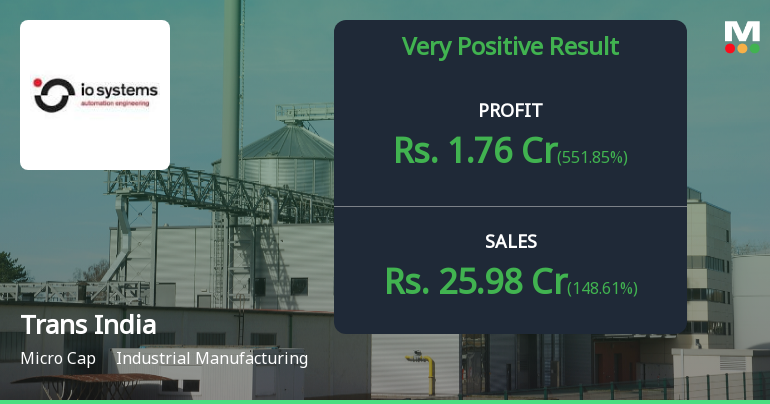
Trans India House Impex Q4 FY26: Strong Quarter Masks Deeper Structural Concerns
Trans India House Impex Limited (BSE: 523752), a micro-cap international trade conglomerate, reported a dramatic turnaround in its Q4 FY26 results, posting a consolidated net profit of ₹1.72 crores—a staggering 537.04% year-on-year surge from ₹0.27 crores in Q4 FY25. However, the stock's brutal -69.78% decline over the past year and persistent bearish technicals suggest investors remain deeply sceptical about the sustainability of this performance. Trading at ₹4.60 with a market capitalisation of just ₹33.00 crores, the company's valuation multiples paint a picture of extreme uncertainty.
Read full news article
Trans India House Impex Ltd is Rated Sell
Trans India House Impex Ltd is rated 'Sell' by MarketsMOJO, with this rating last updated on 26 May 2026. However, the analysis and financial metrics discussed here reflect the stock's current position as of 27 May 2026, providing investors with the latest insights into the company’s performance and outlook.
Read full news article Announcements
Closure of Trading Window
23-Jun-2026 | Source : BSEIntimation for Closure of Trading Window w.e.f 1st July 2026.
Compliances-Reg.24(A)-Annual Secretarial Compliance
28-May-2026 | Source : BSEWe are submitting herewith disclosure under regulation 24A of SEBI (LODR) Regulations 2015 - Annual Secretarial Compliance Report.
Announcement under Regulation 30 (LODR)-Newspaper Publication
27-May-2026 | Source : BSEWe are submitting herewith Disclosure under Regulation 30 of SEBI(LODR) Regulation 2015 - Copies of Newspaper Publication.
Corporate Actions

No Upcoming Board Meetings

No Dividend history available

No Splits history available

No Bonus history available

Trans India House Impex Ltd has announced 1:1 rights issue, ex-date: 08 May 25
Quality key factors
Valuation key factors
Technicals key factors
 Technical Indicator Scale: Bearish, Mildly Bearish, Sideways, Mildly Bullish, Bullish Turned
 Shareholding Snapshot : Dec 2025
Shareholding Compare (%holding)
Non Institution
None
Held by 0 Schemes
Held by 1 FIIs (0.21%)
Sunsource Capital Services India Limited (14.35%)
Macrosilo Techsolution Private Limited (10.06%)
54.35%
Quarterly Results Snapshot (Standalone) - Mar'26 - YoY

YoY Growth in quarter ended Mar 2026 is 148.61% vs 4.71% in Mar 2025
YoY Growth in quarter ended Mar 2026 is 551.85% vs -76.52% in Mar 2025
Half Yearly Results Snapshot (Standalone) - Sep'25
Growth in half year ended Sep 2025 is 101.15% vs -59.13% in Sep 2024

Growth in half year ended Sep 2025 is -121.43% vs -33.33% in Sep 2024
Nine Monthly Results Snapshot (Standalone) - Dec'25
YoY Growth in nine months ended Dec 2025 is 17.70% vs -51.82% in Dec 2024
YoY Growth in nine months ended Dec 2025 is -132.00% vs -42.75% in Dec 2024
Annual Results Snapshot (Consolidated) - Mar'26
Not Applicable: The company has declared_date for only one period
Not Applicable: The company has declared_date for only one period
About Trans India House Impex Ltd

Company Coordinates


