
Compare Suryalak. Cott. with Similar Stocks
Dashboard
Weak Long Term Fundamental Strength with an average Return on Capital Employed (ROCE) of 8.71%
- Poor long term growth as Net Sales has grown by an annual rate of 10.34% and Operating profit at 10.44% over the last 5 years
- Low ability to service debt as the company has a high Debt to EBITDA ratio of 5.19 times
The company has declared Negative results for the last 3 consecutive quarters
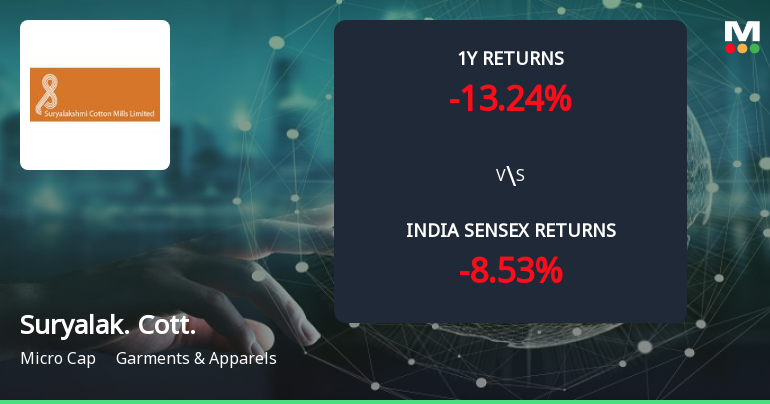
Consistent Underperformance against the benchmark over the last 3 years
Stock DNA
Garments & Apparels
INR 113 Cr (Micro Cap)
40.00
25
0.00%
0.94
1.10%
0.43
Total Returns (Price + Dividend) 
Latest dividend: 1 per share ex-dividend date: Aug-18-2017
Risk Adjusted Returns v/s
Returns Beta

News
Suryalakshmi Cotton Mills Ltd Forms Golden Cross Amid Mixed Technical Signals
The 50-day moving average for Suryalakshmi Cotton Mills Ltd has crossed above the 200-day moving average, creating a golden cross on 30 Jun 2026. Yet, this technical milestone arrives amid a complex backdrop of conflicting momentum indicators and a micro-cap status that calls for cautious interpretation.
Read full news article
Suryalakshmi Cotton Mills Ltd is Rated Strong Sell
Suryalakshmi Cotton Mills Ltd is rated Strong Sell by MarketsMOJO, with this rating last updated on 26 May 2026. However, the analysis and financial metrics presented here reflect the stock’s current position as of 27 June 2026, providing investors with the most up-to-date view of the company’s fundamentals, returns, and overall outlook.
Read full news article
Suryalakshmi Cotton Mills Ltd is Rated Strong Sell
Suryalakshmi Cotton Mills Ltd is rated Strong Sell by MarketsMOJO. This rating was last updated on 26 May 2026. However, the analysis and financial metrics discussed here reflect the company’s current position as of 16 June 2026, providing investors with the most recent and relevant data to assess the stock’s outlook.
Read full news article Announcements
Closure of Trading Window
26-Jun-2026 | Source : BSEIntimation of Trading Window Closure for the quarter ended 30th June 2026
Compliances-Reg.24(A)-Annual Secretarial Compliance
28-May-2026 | Source : BSEAnnual Secretarial Compliance Report for the financial year ended March 2026.
Announcement under Regulation 30 (LODR)-Newspaper Publication
26-May-2026 | Source : BSENewspaper Publication extracts of Audited Financial Results of the Company for the quarter and year ended 31st March 2026
Corporate Actions

No Upcoming Board Meetings

Suryalakshmi Cotton Mills Ltd has declared 10% dividend, ex-date: 18 Aug 17

No Splits history available

No Bonus history available

No Rights history available
Quality key factors
Valuation key factors
Technicals key factors
 Technical Indicator Scale: Bearish, Mildly Bearish, Sideways, Mildly Bullish, Bullish Turned
 Shareholding Snapshot : Mar 2026
Shareholding Compare (%holding)
Promoters
1.2277
Held by 0 Schemes
Held by 1 FIIs (0.21%)
L. N. Agarwal (25.73%)
Santosh Sitaram Goenka (1.95%)
30.96%
Quarterly Results Snapshot (Standalone) - Mar'26 - QoQ

QoQ Growth in quarter ended Mar 2026 is 31.00% vs -4.51% in Dec 2025

QoQ Growth in quarter ended Mar 2026 is 59.62% vs 67.74% in Dec 2025
Half Yearly Results Snapshot (Standalone) - Sep'25
Growth in half year ended Sep 2025 is 5.32% vs -2.03% in Sep 2024
Growth in half year ended Sep 2025 is 1,870.00% vs -105.49% in Sep 2024
Nine Monthly Results Snapshot (Standalone) - Dec'25
YoY Growth in nine months ended Dec 2025 is 1.62% vs 0.34% in Dec 2024
YoY Growth in nine months ended Dec 2025 is 179.27% vs -69.63% in Dec 2024
Annual Results Snapshot (Standalone) - Mar'26
YoY Growth in year ended Mar 2026 is 0.37% vs 1.20% in Mar 2025
YoY Growth in year ended Mar 2026 is -14.05% vs 0.55% in Mar 2025
About Suryalakshmi Cotton Mills Ltd

Company Coordinates


