
Compare Camex with Similar Stocks
Dashboard
Weak Long Term Fundamental Strength with an average Return on Capital Employed (ROCE) of 6.17%
- Poor long term growth as Net Sales has grown by an annual rate of 0.97% over the last 5 years
Positive results in Mar 26
With ROCE of 9.5, it has a Attractive valuation with a 0.9 Enterprise value to Capital Employed
Majority shareholders : Non Institution
Stock DNA
Commodity Chemicals
INR 43 Cr (Micro Cap)
NA (Loss Making)
21
0.00%
0.12
6.67%
0.91
Total Returns (Price + Dividend) 
Latest dividend: 0.5 per share ex-dividend date: Sep-08-2014
Risk Adjusted Returns v/s
Returns Beta

News
Camex Ltd Upgraded to Hold by MarketsMOJO on Improved Technicals and Financials
Camex Ltd, a micro-cap player in the commodity chemicals sector, has seen its investment rating upgraded from Sell to Hold as of 12 June 2026. This change reflects a combination of improved technical indicators, positive quarterly financial results, and a more attractive valuation profile, signalling a cautious but optimistic outlook for investors.
Read full news article
Camex Ltd is Rated Sell by MarketsMOJO
Camex Ltd is rated 'Sell' by MarketsMOJO, with this rating last updated on 13 May 2026. However, the analysis and financial metrics discussed here reflect the stock's current position as of 27 May 2026, providing investors with the most up-to-date view of the company’s fundamentals, valuation, financial trends, and technical outlook.
Read full news article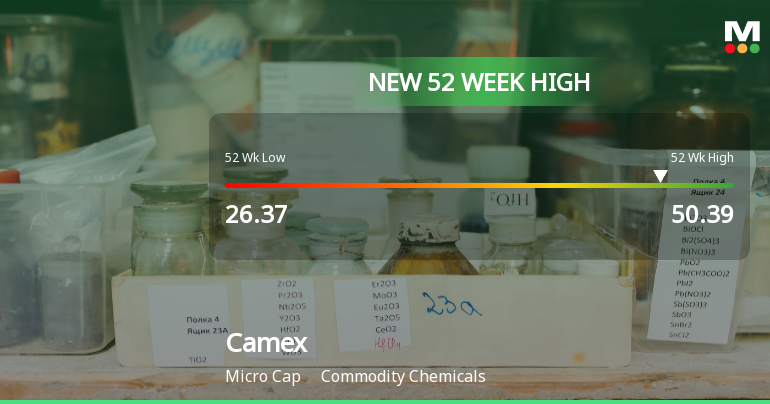
Broad-Based Technical Strength Lifts Camex Ltd to 52-Week High of Rs 50.39
Surging past its previous peak, Camex Ltd touched a fresh 52-week high of Rs 50.39 on 18 Jun 2026, marking a remarkable rally of 91% from its low of Rs 26.37 over the past year. This milestone comes amid a sustained four-day gain, reflecting strong price momentum despite a broadly weakening market backdrop.
Read full news article Announcements
Compliances-Reg.24(A)-Annual Secretarial Compliance
29-May-2026 | Source : BSEAnnual Secretarial Compliance Report for the year ended March 31 2026 of Camex Limited
Statement Of Deviation Or Variation In Utilization Of Funds Raised Under Regulation 32 Of SEBI (Listing Obligations And Disclosure Requirements) Regulation 2015 For The Quarter Ended March 312026
28-May-2026 | Source : BSEPursuant to Regulation 32 of SEBI (Listing Obligations and Disclosre Requirements Regulations 2015 as amended please find the enclosed herewith the Statement of Deviation or Variation in utilization of funds raised through Initial Public Offer (IPO) by the Company for the quarter ended March 312026 revieved by the Audit Committee at its meeting held on April 072026.
Announcement under Regulation 30 (LODR)-Newspaper Publication
13-May-2026 | Source : BSESubmission of Newspaper Clippings of the Publication od Extract of Audited Financial Results for the Quarter and Financial Year ended on March 31 2026.
Corporate Actions

No Upcoming Board Meetings

Camex Ltd has declared 5% dividend, ex-date: 08 Sep 14

No Splits history available

No Bonus history available

No Rights history available
Quality key factors
Valuation key factors
Technicals key factors
 Technical Indicator Scale: Bearish, Mildly Bearish, Sideways, Mildly Bullish, Bullish Turned
 Shareholding Snapshot : Mar 2026
Shareholding Compare (%holding)
Non Institution
None
Held by 0 Schemes
Held by 0 FIIs
Chandraprakash Bhanwarlal Chopra (18.78%)
Rajesh Nahata (9.74%)
37.55%
Quarterly Results Snapshot (Standalone) - Mar'26 - YoY

YoY Growth in quarter ended Mar 2026 is 11.13% vs -1.01% in Mar 2025
YoY Growth in quarter ended Mar 2026 is 1,106.67% vs -90.32% in Mar 2025
Half Yearly Results Snapshot (Standalone) - Sep'25
Growth in half year ended Sep 2025 is 4.92% vs -1.61% in Sep 2024

Growth in half year ended Sep 2025 is -70.05% vs 176.00% in Sep 2024
Nine Monthly Results Snapshot (Standalone) - Dec'25
YoY Growth in nine months ended Dec 2025 is 12.20% vs -7.02% in Dec 2024
YoY Growth in nine months ended Dec 2025 is -17.71% vs -8.38% in Dec 2024
Annual Results Snapshot (Standalone) - Mar'26
YoY Growth in year ended Mar 2026 is 11.90% vs -5.75% in Mar 2025
YoY Growth in year ended Mar 2026 is 71.96% vs -45.38% in Mar 2025
About Camex Ltd

Company Coordinates


