
Compare IMEC Services with Similar Stocks
Stock DNA
Commercial Services & Supplies
INR 30 Cr (Micro Cap)
NA (Loss Making)
27
0.00%
-0.02
18.65%
0.96
Total Returns (Price + Dividend) 
IMEC Services for the last several years.
Risk Adjusted Returns v/s
Returns Beta

News
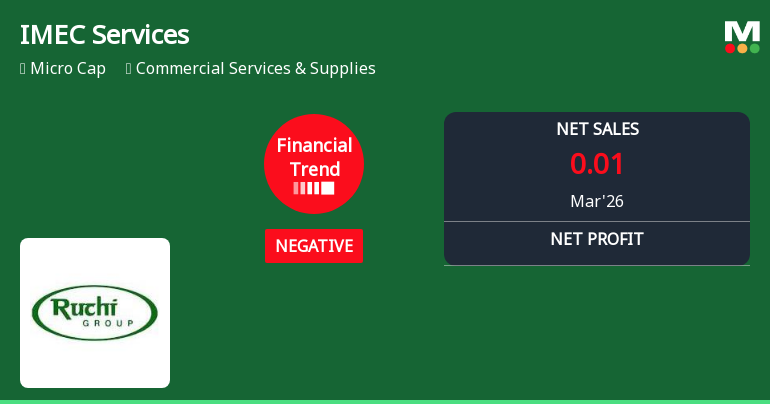
IMEC Services Ltd Reports Negative Financial Trend Amid Mixed Quarterly Results
IMEC Services Ltd, a micro-cap player in the Commercial Services & Supplies sector, has reported a shift from a flat to a negative financial trend in the quarter ending March 2026. Despite a notable rise in quarterly profit after tax (PAT), the company’s overall financial health shows signs of strain, with key profitability and operational metrics deteriorating compared to historical averages.
Read full news article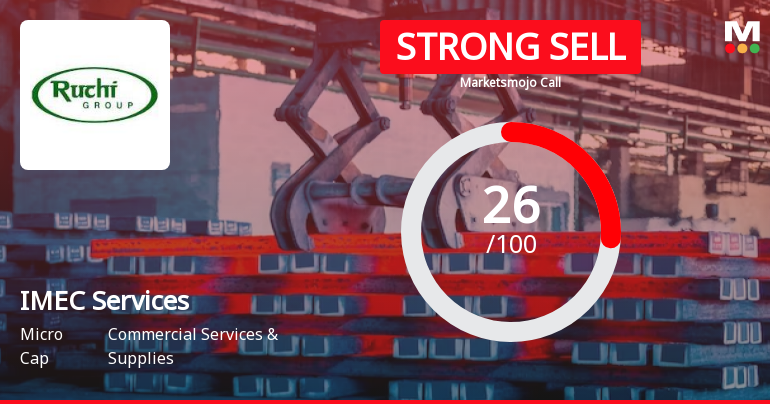
IMEC Services Ltd is Rated Strong Sell
IMEC Services Ltd is rated Strong Sell by MarketsMOJO, with this rating last updated on 28 Apr 2026. However, the analysis and financial metrics discussed here reflect the stock’s current position as of 14 May 2026, providing investors with the latest insights into the company’s performance and outlook.
Read full news article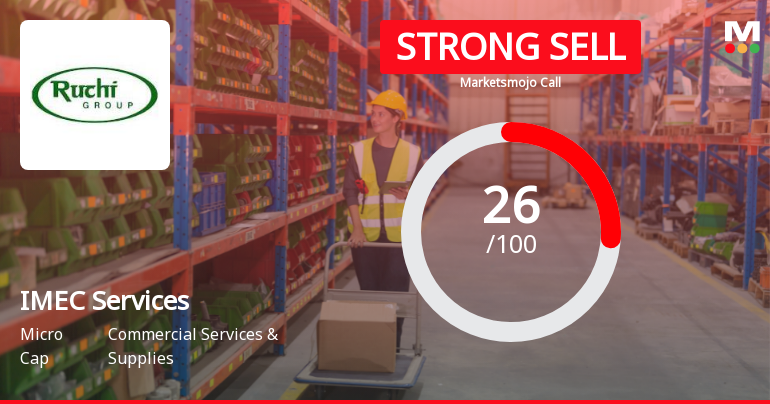
IMEC Services Ltd Downgraded to Strong Sell Amid Technical Weakness and Financial Concerns
IMEC Services Ltd has seen its investment rating downgraded from Sell to Strong Sell as of 28 Apr 2026, driven primarily by deteriorating technical indicators and persistent financial weaknesses. Despite a remarkable one-year stock return of 196.1%, the company’s flat quarterly financial performance, high promoter share pledging, and bearish technical signals have raised concerns among investors and analysts alike.
Read full news article Announcements
Announcement under Regulation 30 (LODR)-Newspaper Publication
30-May-2026 | Source : BSENewspaper Publication of extract of the Audited standalone financials results for the quarter and year ended March 312026.
Compliances-Reg.24(A)-Annual Secretarial Compliance
29-May-2026 | Source : BSEAnnual Secretarial Compliance Report for the financial year ended March 312026 under regulation 24A of the SEBI (LODR) Regulations 2015.
Board Meeting Outcome for Outcome Of Board Meeting Held On 28Th May 2026 Pursuant To Regulation 30 And Regulation 33 Of SEBI (LODR) Regulations 2015.
28-May-2026 | Source : BSEOutcome of Board Meeting held on 28th May 2026.
Corporate Actions

No Upcoming Board Meetings

No Dividend history available

No Splits history available

No Bonus history available

No Rights history available
Quality key factors
Valuation key factors
Technicals key factors
 Technical Indicator Scale: Bearish, Mildly Bearish, Sideways, Mildly Bullish, Bullish Turned
 Shareholding Snapshot : Mar 2026
Shareholding Compare (%holding)
Non Institution
68.8922
Held by 4 Schemes (0.16%)
Held by 0 FIIs
Param Foundation Private Limited (19.59%)
Suyash Shahra (5.74%)
29.29%
Quarterly Results Snapshot (Standalone) - Mar'26 - QoQ

QoQ Growth in quarter ended Mar 2026 is 0.00% vs -95.24% in Dec 2025
QoQ Growth in quarter ended Mar 2026 is 1,169.44% vs -227.27% in Dec 2025
Half Yearly Results Snapshot (Standalone) - Sep'25

Growth in half year ended Sep 2025 is -87.91% vs -28.06% in Sep 2024
Growth in half year ended Sep 2025 is -2,666.67% vs 102.75% in Sep 2024
Nine Monthly Results Snapshot (Standalone) - Dec'25
YoY Growth in nine months ended Dec 2025 is -93.13% vs 16.32% in Dec 2024
YoY Growth in nine months ended Dec 2025 is -263.74% vs 139.91% in Dec 2024
Annual Results Snapshot (Standalone) - Mar'26
YoY Growth in year ended Mar 2026 is -99.18% vs 340.25% in Mar 2025
YoY Growth in year ended Mar 2026 is -75.57% vs 84,633.33% in Mar 2025
About IMEC Services Ltd

Company Coordinates


