
Compare Lactose (India) with Similar Stocks
Dashboard
Healthy long term growth as Net Sales has grown by an annual rate of 36.10% and Operating profit at 45.23%
Positive results in Mar 26
With ROCE of 9.5, it has a Attractive valuation with a 1.5 Enterprise value to Capital Employed
26.07% of Promoter Shares are Pledged
Market Beating performance in long term as well as near term
Stock DNA
Pharmaceuticals & Biotechnology
INR 132 Cr (Micro Cap)
22.00
34
0.00%
0.95
9.37%
2.02
Total Returns (Price + Dividend) 
Lactose (India) for the last several years.
Risk Adjusted Returns v/s
Returns Beta

News
Lactose (India) Ltd Upgraded to Hold on Improved Technicals and Financial Trends
Lactose (India) Ltd has seen its investment rating upgraded from Sell to Hold, reflecting a notable improvement in its technical indicators alongside robust financial performance. The upgrade, effective from 19 June 2026, is driven by positive shifts across four key parameters: quality, valuation, financial trend, and technicals, signalling a more balanced outlook for this micro-cap pharmaceutical player.
Read full news article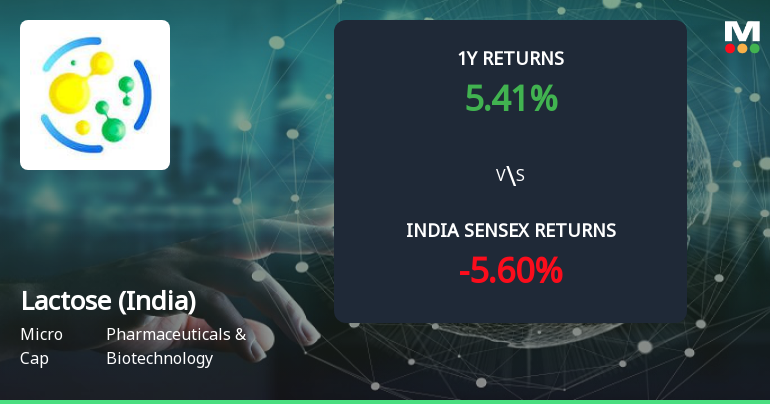
Golden Cross Forms in Lactose (India) Ltd — On a Day the Stock Fell 1.87%. What the Mixed Signals Mean
The 50-day moving average for Lactose (India) Ltd has crossed above the 200-day moving average, signalling a golden cross on 19 Jun 2026. Yet, the stock declined 1.87% on the day this technical event occurred, while monthly momentum indicators remain bearish. This juxtaposition of signals calls for a detailed examination of the broader technical and fundamental context.
Read full news article
Lactose (India) Ltd is Rated Sell by MarketsMOJO
Lactose (India) Ltd is rated 'Sell' by MarketsMOJO, with this rating last updated on 20 May 2026. However, the analysis and financial metrics discussed here reflect the stock’s current position as of 15 June 2026, providing investors with an up-to-date perspective on the company’s fundamentals, valuation, financial trends, and technical outlook.
Read full news article Announcements
Board Meeting Outcome for Outcome Of Board Meeting Pursuant To Regulation 30 Of SEBI (Listing Obligations And Disclosure Requirements) Regulations 2015 For Forfeiture Of Convertible Warrants
18-Jun-2026 | Source : BSEConsidered and Approved the Forfeiture of Convertible Warrants (Warrants) which the Company had issued and allotted 1500000 Convertible Warrants on preferential basis to following persons (other than Promoters & Promoter Group) at a conversion price of INR. 174/- per warrant (INR 10/- as face value & INR 164/- as premium) on December 5 2024
Board Meeting Intimation for Intimation Of Board Meeting Pursuant To Regulation 29 Of SEBI (Listing Obligations And Disclosure Requirements) Regulations 2015.
15-Jun-2026 | Source : BSELactose India Ltdhas informed BSE that the meeting of the Board of Directors of the Company is scheduled on 18/06/2026 inter alia to consider and approve 1.To forfeit 1500000 (Fifteen Lakhs) convertible share warrants allotted on preferential basis to M/s. SG General Dealers LLP on account of non-payment of the balance consideration required for conversion of the warrants into equity shares within the stipulated period prescribed under the terms of issue and applicable provisions of the SEBI (Issue of Capital and Disclosure Requirements) Regulations 2018 as amended. 2. To consider any other business with the permission of chair.
Compliances-Reg.24(A)-Annual Secretarial Compliance
28-May-2026 | Source : BSEWe hereby submit Annual Secretarial Compliance report for financial year ended 31st March 2026.
Corporate Actions

No Upcoming Board Meetings

No Dividend history available

No Splits history available

No Bonus history available

No Rights history available
Quality key factors
Valuation key factors
Technicals key factors
 Technical Indicator Scale: Bearish, Mildly Bearish, Sideways, Mildly Bullish, Bullish Turned
 Shareholding Snapshot : Mar 2026
Shareholding Compare (%holding)
Promoters
26.0693
Held by 0 Schemes
Held by 0 FIIs
Sangita Maheshwari (30.73%)
Madhusha Holdings Private Limited (3.99%)
38.18%
Quarterly Results Snapshot (Standalone) - Mar'26 - QoQ

QoQ Growth in quarter ended Mar 2026 is 24.48% vs -10.71% in Dec 2025
QoQ Growth in quarter ended Mar 2026 is 254.72% vs -75.46% in Dec 2025
Half Yearly Results Snapshot (Standalone) - Sep'25
Growth in half year ended Sep 2025 is 34.80% vs 15.46% in Sep 2024

Growth in half year ended Sep 2025 is -14.88% vs 144.32% in Sep 2024
Nine Monthly Results Snapshot (Standalone) - Dec'25
YoY Growth in nine months ended Dec 2025 is 32.61% vs 4.90% in Dec 2024
YoY Growth in nine months ended Dec 2025 is -7.30% vs 2.96% in Dec 2024
Annual Results Snapshot (Standalone) - Mar'26
YoY Growth in year ended Mar 2026 is 40.28% vs 2.20% in Mar 2025
YoY Growth in year ended Mar 2026 is 17.44% vs -24.01% in Mar 2025
About Lactose (India) Ltd

Company Coordinates


