
Compare Spectrum Foods with Similar Stocks
Total Returns (Price + Dividend) 
Spectrum Foods for the last several years.
Risk Adjusted Returns v/s
Returns Beta

News
Spectrum Foods Ltd Downgraded to Strong Sell Amidst Weak Fundamentals and Mixed Valuation
Spectrum Foods Ltd, a micro-cap player in the FMCG sector, has seen its investment rating downgraded from Sell to Strong Sell as of 15 Jul 2026. Despite an improvement in valuation metrics, the company’s weak financial trends, poor quality scores, and deteriorating technical indicators have collectively triggered this rating change, signalling caution for investors.
Read full news article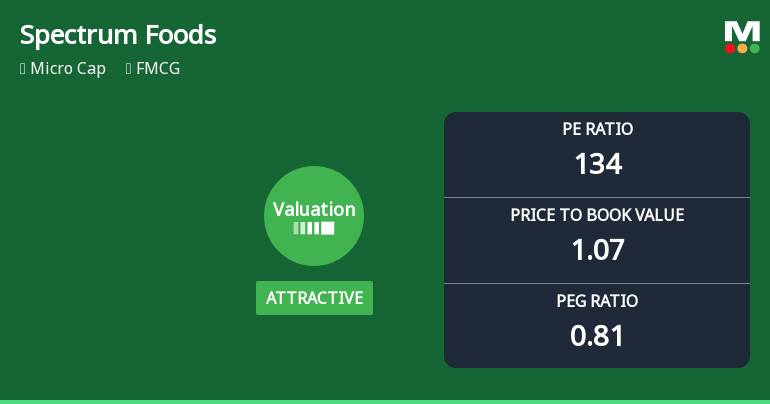
Spectrum Foods Ltd Valuation Shifts Amid Mixed Market Returns
Spectrum Foods Ltd, a micro-cap player in the FMCG sector, has witnessed a notable shift in its valuation parameters, moving from a very attractive to an attractive rating. Despite a lofty price-to-earnings (P/E) ratio of 134.45, the company’s price-to-book value (P/BV) remains modest at 1.07, signalling nuanced investor sentiment amid mixed financial metrics and peer comparisons.
Read full news article
Spectrum Foods Ltd Upgraded to Sell on Improved Technicals and Valuation
Spectrum Foods Ltd, a micro-cap player in the FMCG sector, has seen its investment rating upgraded from Strong Sell to Sell as of 8 July 2026. This shift reflects nuanced changes across valuation, technical indicators, financial trends, and quality assessments, signalling a cautious but slightly more favourable outlook for investors.
Read full news article Announcements
Announcement under Regulation 30 (LODR)-Press Release / Media Release
13-Jul-2026 | Source : BSEConstruction Progress Update for Samskara Pushkar 5-Star Resort Project.
Compliances-Certificate under Reg. 74 (5) of SEBI (DP) Regulations 2018
04-Jul-2026 | Source : BSECompliance certificate under Regulation 74(5) OF SEBI (DP) Regulations 2018 for the first Quarter ended 30.06.2026.
Revised Audited Financial Results For The Fourth Quarter And Year Ended 31St March 2026.
30-Jun-2026 | Source : BSEPDF Attached
Corporate Actions

No Upcoming Board Meetings

No Dividend history available

No Splits history available

No Bonus history available

Spectrum Foods Ltd has announced 4:1 rights issue, ex-date: 27 Mar 24
Quality key factors
Valuation key factors
Technicals key factors
 Technical Indicator Scale: Bearish, Mildly Bearish, Sideways, Mildly Bullish, Bullish Turned
 Shareholding Snapshot : Mar 2026
Shareholding Compare (%holding)
Non Institution
None
Held by 0 Schemes
Held by 0 FIIs
Girdhar Saboo (46.63%)
Saboo Sodium Chloro Limited (5.62%)
39.36%
Quarterly Results Snapshot (Standalone) - Mar'26 - QoQ

QoQ Growth in quarter ended Mar 2026 is -32.29% vs 0.26% in Dec 2025
QoQ Growth in quarter ended Mar 2026 is -631.75% vs -59.35% in Dec 2025
Half Yearly Results Snapshot (Standalone) - Sep'25

Growth in half year ended Sep 2025 is 28.24% vs 11.56% in Sep 2024
Growth in half year ended Sep 2025 is -25.85% vs -28.94% in Sep 2024
Nine Monthly Results Snapshot (Standalone) - Dec'25
YoY Growth in nine months ended Dec 2025 is 30.61% vs 11.29% in Dec 2024
YoY Growth in nine months ended Dec 2025 is -15.24% vs -40.52% in Dec 2024
Annual Results Snapshot (Standalone) - Mar'26
YoY Growth in year ended Mar 2026 is 25.59% vs 1.15% in Mar 2025
YoY Growth in year ended Mar 2026 is 141.67% vs -90.98% in Mar 2025
About Spectrum Foods Ltd

Company Coordinates


