
Compare Garment Mantra with Similar Stocks
Dashboard
With a Operating Losses, the company has a Weak Long Term Fundamental Strength
- Low ability to service debt as the company has a high Debt to EBITDA ratio of -21.77 times
- The company has been able to generate a Return on Equity (avg) of 5.91% signifying low profitability per unit of shareholders funds
Flat results in Mar 26
Risky - Negative EBITDA
Consistent Underperformance against the benchmark over the last 3 years
Stock DNA
Garments & Apparels
INR 66 Cr (Micro Cap)
23.00
25
0.00%
0.27
3.73%
0.84
Total Returns (Price + Dividend) 
Garment Mantra for the last several years.
Risk Adjusted Returns v/s
Returns Beta

News

Garment Mantra Lifestyle Ltd is Rated Strong Sell
Garment Mantra Lifestyle Ltd is rated Strong Sell by MarketsMOJO, with this rating last updated on 01 June 2026. However, the analysis and financial metrics discussed here reflect the company’s current position as of 29 June 2026, providing investors with the latest insights into the stock’s performance and outlook.
Read full news article
Garment Mantra Lifestyle Ltd is Rated Strong Sell
Garment Mantra Lifestyle Ltd is rated Strong Sell by MarketsMOJO, with this rating last updated on 01 June 2026. However, the analysis and financial metrics discussed here reflect the company’s current position as of 17 June 2026, providing investors with the latest insights into its performance and outlook.
Read full news article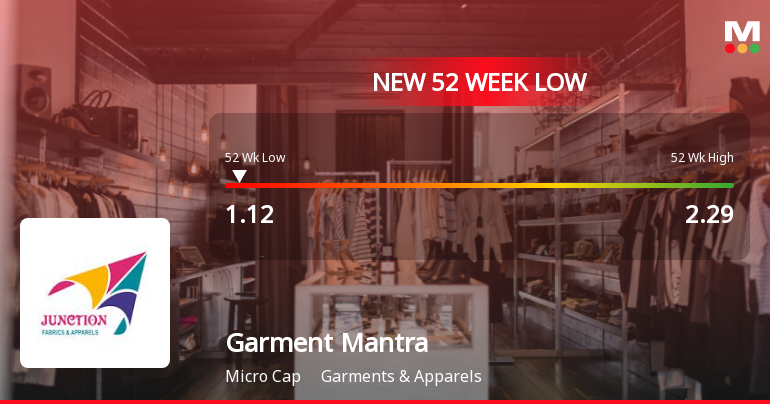
Garment Mantra Lifestyle Ltd Falls to 52-Week Low of Rs 1.12 as Sell-Off Deepens
A sustained decline has pushed Garment Mantra Lifestyle Ltd to a fresh 52-week low of Rs 1.12 on 17 Jun 2026, marking a 36.67% drop over the past year and a stark contrast to the broader market's modest losses.
Read full news article Announcements
Closure of Trading Window
25-Jun-2026 | Source : BSEPursuant to Companys Code of Conduct for regulating monitoring and reporting of trading by insiders and SEBI (Prohibition of Insider Trading) Regulation 2015 the trading window of the company shall remain closed with effect from 1st July 2026 for designated persons till 48 hours after the declaration of unaudited financial results of the Company for the quarter ended 30th June 2026
Announcement Under Regulation 30 Of SEBI(LODR) - Forfeiture Of Shares
17-Jun-2026 | Source : BSEPursuant to Regulation 30 of SEBI(LODR) forfeiture of Partly paid shares issued under Rights Issue is intimated herewith
Announcement under Regulation 30 (LODR)-Monthly Business Updates
02-Jun-2026 | Source : BSEPursuant to Regulation 30 of SEBI(LODR) the business update is submitted herewith
Corporate Actions

No Upcoming Board Meetings

No Dividend history available

Garment Mantra Lifestyle Ltd has announced 1:10 stock split, ex-date: 18 May 22

Garment Mantra Lifestyle Ltd has announced 1:1 bonus issue, ex-date: 03 Sep 24

Garment Mantra Lifestyle Ltd has announced 39:20 rights issue, ex-date: 17 Apr 25
Quality key factors
Valuation key factors
Technicals key factors
 Technical Indicator Scale: Bearish, Mildly Bearish, Sideways, Mildly Bullish, Bullish Turned
 Shareholding Snapshot : May 2026
Shareholding Compare (%holding)
Non Institution
None
Held by 0 Schemes
Held by 1 FIIs (0.2%)
Prem Aggarwal (27.49%)
None
53.4%
Quarterly Results Snapshot (Consolidated) - Mar'26 - YoY

YoY Growth in quarter ended Mar 2026 is 73.89% vs -50.18% in Mar 2025

YoY Growth in quarter ended Mar 2026 is -477.69% vs 251.35% in Mar 2025
Half Yearly Results Snapshot (Consolidated) - Sep'25
Growth in half year ended Sep 2025 is 35.68% vs 24.60% in Sep 2024
Growth in half year ended Sep 2025 is 268.35% vs 95.77% in Sep 2024
Nine Monthly Results Snapshot (Consolidated) - Dec'25
YoY Growth in nine months ended Dec 2025 is 106.52% vs 3.81% in Dec 2024
YoY Growth in nine months ended Dec 2025 is 498.09% vs -21.89% in Dec 2024
Annual Results Snapshot (Consolidated) - Mar'26
YoY Growth in year ended Mar 2026 is 97.89% vs -19.33% in Mar 2025
YoY Growth in year ended Mar 2026 is 56.10% vs 14.34% in Mar 2025
About Garment Mantra Lifestyle Ltd

Company Coordinates


