
Compare Restile Ceramics with Similar Stocks
Dashboard
With a Negative Book Value, the company has a Weak Long Term Fundamental Strength
- Poor long term growth as Net Sales has grown by an annual rate of 25.29% and Operating profit at 0% over the last 5 years
- The company has a negative book value of Rs 31.72 crore
Flat results in Mar 26
Risky - Negative Operating Profits
Underperformed the market in the last 1 year
Stock DNA
Diversified consumer products
INR 65 Cr (Micro Cap)
NA (Loss Making)
32
0.00%
-1.16
0.19%
-2.11
Total Returns (Price + Dividend) 
Restile Ceramics for the last several years.
Risk Adjusted Returns v/s
Returns Beta

News

Restile Ceramics Ltd Downgraded to Strong Sell Amid Technical and Fundamental Weaknesses
Restile Ceramics Ltd has been downgraded from a Sell to a Strong Sell rating as of 29 June 2026, reflecting deteriorating technical indicators and weak fundamental performance. The micro-cap stock, operating in the diversified consumer products sector, has seen its Mojo Score decline to 23.0, signalling heightened risk for investors amid sideways technical trends and flat financial results.
Read full news article
Restile Ceramics Ltd Upgraded to Sell on Technical Improvement Despite Weak Fundamentals
Restile Ceramics Ltd has seen its investment rating upgraded from Strong Sell to Sell as of 19 June 2026, driven primarily by an improvement in technical indicators despite persistent fundamental challenges. The micro-cap stock, operating in the diversified consumer products sector, now presents a cautiously optimistic technical outlook while continuing to grapple with weak financial trends and valuation concerns.
Read full news article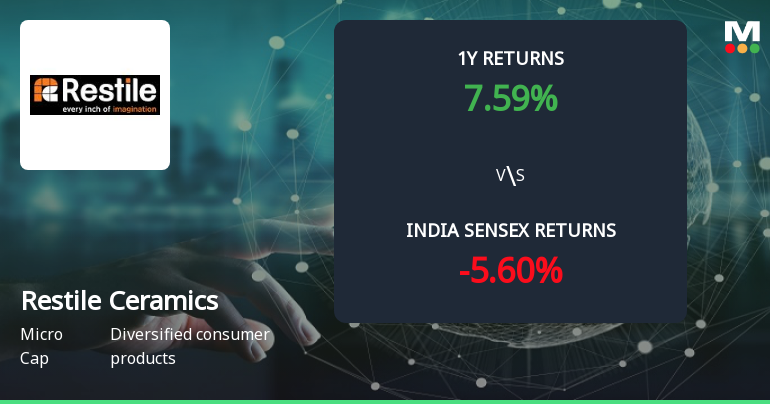
Golden Cross Forms in Restile Ceramics Ltd — On a Day the Stock Gained 1.54%. What the Mixed Signals Mean
The 50-day moving average has crossed above the 200-day moving average for Restile Ceramics Ltd, signalling a golden cross on 19 Jun 2026. However, the stock’s modest 1.54% gain on the day and a mixed technical backdrop suggest the signal requires careful interpretation rather than blind optimism.
Read full news article Announcements
Closure of Trading Window
25-Jun-2026 | Source : BSEPlease find attached Intimation of closure of Trading Window
Announcement under Regulation 30 (LODR)-Newspaper Publication
27-May-2026 | Source : BSEPlease find attached Newspaper Publication of the Audited Financial Results for the financial year ended March 31 2026
Board Meeting Outcome for Outcome Of The Board Meeting Held On Monday May 25 2026.
25-May-2026 | Source : BSEPursuant to Regulation 30 and 33 of the Securities and Exchange Board of India (Listing Obligations and Disclosure Requirements) Regulations 2015 we hereby inform you that the Board of Directors of the Company at their Meeting held today i.e. May 25 2026 have inter alia considered and approved the Audited Financial Statements including Balance Sheet as at March 31 2026 the Statement of profit and Loss and the Cash Flow Statement and notes thereon for the Financial Year ended March 31 2026 together with the Audit Report as on March 31 2026 and Audited Financial Results for the quarter and financial year ended March 31 2026 and affirms their satisfaction over the financial statements and results of the Company. You are requested to take the above information on record.
Corporate Actions

No Upcoming Board Meetings

No Dividend history available

No Splits history available

No Bonus history available

Restile Ceramics Ltd has announced 26:35 rights issue, ex-date: 15 Sep 08
Quality key factors
Valuation key factors
Technicals key factors
 Technical Indicator Scale: Bearish, Mildly Bearish, Sideways, Mildly Bullish, Bullish Turned
 Shareholding Snapshot : Mar 2026
Shareholding Compare (%holding)
Promoters
None
Held by 5 Schemes (0.02%)
Held by 0 FIIs
Solomed Capital Pte Ltd (63.69%)
Springboard Pacific Enterprise Inc (14.59%)
8.05%
Quarterly Results Snapshot (Standalone) - Mar'26 - QoQ

QoQ Growth in quarter ended Mar 2026 is -1.37% vs -25.89% in Dec 2025
QoQ Growth in quarter ended Mar 2026 is -31.58% vs -138.78% in Dec 2025
Half Yearly Results Snapshot (Standalone) - Sep'25
Growth in half year ended Sep 2025 is 231.71% vs 49.09% in Sep 2024
Growth in half year ended Sep 2025 is 176.00% vs 3.85% in Sep 2024
Nine Monthly Results Snapshot (Standalone) - Dec'25
YoY Growth in nine months ended Dec 2025 is 283.49% vs 47.30% in Dec 2024
YoY Growth in nine months ended Dec 2025 is 125.68% vs -17.46% in Dec 2024
Annual Results Snapshot (Standalone) - Mar'26
YoY Growth in year ended Mar 2026 is 293.71% vs 52.13% in Mar 2025
YoY Growth in year ended Mar 2026 is 93.75% vs -5.49% in Mar 2025
About Restile Ceramics Ltd

Company Coordinates


