
 Results Declared: Standard Inds. has declared results on 10 Aug 2026! Click here to unlock the latest financial performanceTechnical Trend Update: Standard Inds. witnessed a change in Technical Grade on 10 Aug 2026. Click here to discover latest technical change!Mojo Score Change: Standard Inds. has changed its score on 11 Aug 2026. Click here to unlock latest mojo score!Dividend Alert: Standard Industries Ltd has declared 5% dividend, ex-date: 11 Aug 26
 Price Point
Compare Standard Inds. with Similar Stocks
ScoreDashboard
High Management Efficiency with a high ROE of 29.04%
The company is Net-Debt Free
Healthy long term growth as Net Sales has grown by an annual rate of 75.41% and Operating profit at 44.33%
With a growth in Net Sales of 1881.17%, the company declared Outstanding results in Jun 26
With ROE of -16.9, it has a Fair valuation with a 1.2 Price to Book Value


 Total Returns
Total Returns (Price + Dividend) 
Latest dividend: 0.25 per share ex-dividend date: Aug-11-2026
Risk Adjusted Returns v/s
Returns Beta
 News & Corporate Actions
News

Standard Industries Ltd Upgraded to Strong Buy on Robust Financial and Technical Performance
Standard Industries Ltd has seen its investment rating upgraded from Buy to Strong Buy, reflecting significant improvements across financial performance, valuation metrics, technical indicators, and overall quality. This upgrade, effective from 11 August 2026, is underpinned by outstanding quarterly results, a more favourable valuation profile, and a bullish technical outlook, positioning the micro-cap realty stock as a compelling opportunity for investors.
Read full news article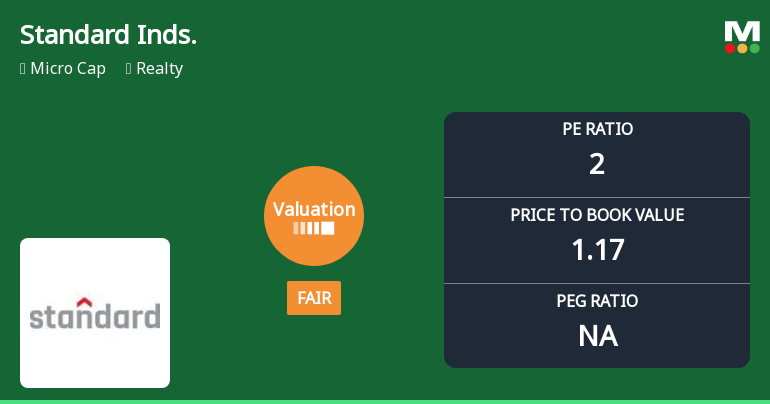
Standard Industries Ltd Valuation Shifts Signal Renewed Price Attractiveness
Standard Industries Ltd, a micro-cap player in the Realty sector, has witnessed a significant shift in its valuation parameters, moving from a risky to a fair valuation grade. This change, coupled with a strong Mojo Score upgrade to 80.0 and a day gain exceeding 10%, highlights a renewed price attractiveness that investors should carefully consider amid the broader market context.
Read full news article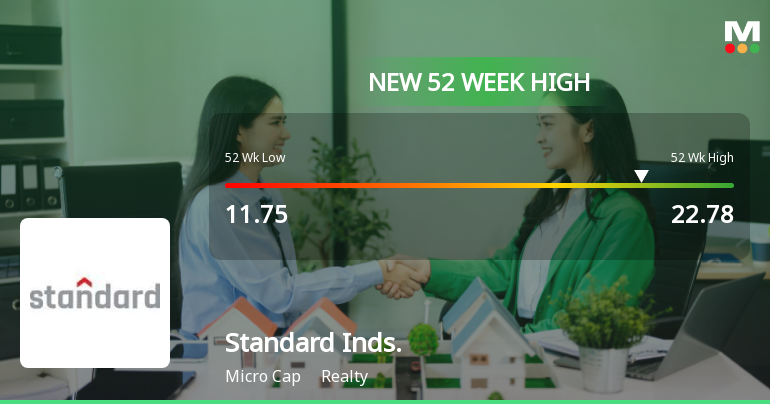
Broad-Based Technical Strength Lifts Standard Industries Ltd to 52-Week High of Rs 22.78
With a decisive gap-up opening and a 5.57% gain on 11 Aug 2026, Standard Industries Ltd surged to a fresh 52-week high of Rs 22.78, marking a significant milestone in its price journey from a low of Rs 11.75. This rally is underpinned by a confluence of bullish technical indicators and robust price momentum that have propelled the stock well above its key moving averages.
Read full news article Announcements
Board Meeting Outcome for OUTCOME OF THE BOARD MEETING OF STANDARD INDUSTRIES
10-Aug-2026 | Source : BSEUnaudited Standalone And Consolidated Financial Results For The Quarter Ended June 30 2026
10-Aug-2026 | Source : BSEUnaudited Standalone and Consolidated Financial Results for the quarter ended June 30 2026
Board Meeting Intimation for Intimation Of Board Meeting For Approval Of Unaudited Financial Results (Standalone And Consolidated) Of The Company For The Quarter Ended 30Th June 2026 With Limited Review Report By The Auditor
31-Jul-2026 | Source : BSEStandard Industries Ltdhas informed BSE that the meeting of the Board of Directors of the Company is scheduled on 10/08/2026 inter alia to consider and approve Intimation of Board Meeting for approval of Unaudited Financial Results (Standalone and Consolidated) of the Company for the quarter ended 30th June 2026 with Limited Review Report by the Auditor
Corporate Actions

No Upcoming Board Meetings

Standard Industries Ltd has declared 5% dividend, ex-date: 11 Aug 26

No Splits history available

No Bonus history available

No Rights history available
Key FactorsQuality key factors
Valuation key factors
Technicals key factors
Technical Indicator Scale: Bearish, Mildly Bearish, Sideways, Mildly Bullish, Bullish Turned ShareholdingShareholding Snapshot : Jun 2026
Shareholding Compare (%holding)
Non Institution
None
Held by 11 Schemes (0.1%)
Held by 0 FIIs
Stanrose Mafatlal Investments & Finance Limited (19.44%)
Satin Limited (38.86%)
31.45%
FinancialQuarterly Results Snapshot (Consolidated) - Jun'26 - QoQ
 Compare with Peers
QoQ Growth in quarter ended Jun 2026 is 1,881.17% vs 25.74% in Mar 2026
QoQ Growth in quarter ended Jun 2026 is 1,214.98% vs -56.06% in Mar 2026

Half Yearly Results Snapshot (Consolidated) - Sep'25
Growth in half year ended Sep 2025 is 48.46% vs -22.76% in Sep 2024

Growth in half year ended Sep 2025 is -122.97% vs 54.07% in Sep 2024
Nine Monthly Results Snapshot (Consolidated) - Dec'25
YoY Growth in nine months ended Dec 2025 is 28.92% vs -4.55% in Dec 2024
YoY Growth in nine months ended Dec 2025 is -35.65% vs 10.47% in Dec 2024
Annual Results Snapshot (Consolidated) - Mar'26
YoY Growth in year ended Mar 2026 is 22.96% vs 3.79% in Mar 2025
YoY Growth in year ended Mar 2026 is -44.34% vs -10,292.31% in Mar 2025
 Company CV
About Standard Industries Ltd

Company Coordinates










