
Compare Patel Integrated with Similar Stocks
Stock DNA
Transport Services
INR 106 Cr (Micro Cap)
10.00
37
2.07%
-0.19
7.77%
0.82
Total Returns (Price + Dividend) 
Latest dividend: 0.3 per share ex-dividend date: Sep-01-2025
Risk Adjusted Returns v/s
Returns Beta

News
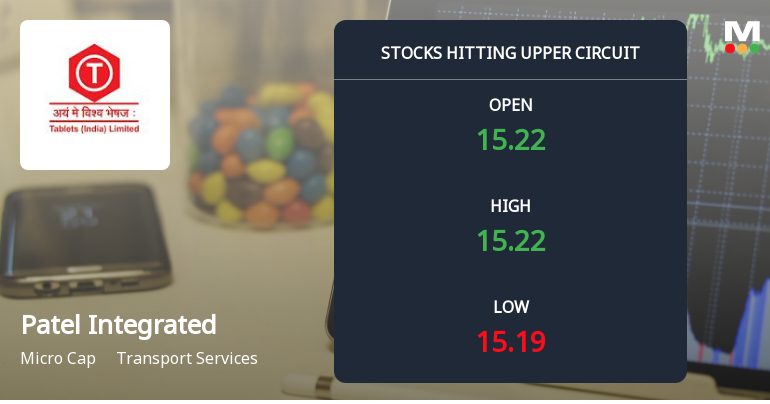
Patel Integrated Logistics Ltd Locks at Upper Circuit With 4.97% Gain — Buyers Queue, Sellers Absent
At Rs 15.20, the buying was done — not because demand dried up, but because the exchange wouldn't let the stock go any higher. Patel Integrated Logistics Ltd locked at its upper circuit of 4.97% on 24 Jun 2026, with buyers queuing and no sellers willing to part with shares.
Read full news article
Patel Integrated Logistics Ltd is Rated Sell
Patel Integrated Logistics Ltd is rated 'Sell' by MarketsMOJO, with this rating last updated on 12 May 2026. However, the analysis and financial metrics discussed here reflect the stock's current position as of 16 June 2026, providing investors with the latest insights into its performance and outlook.
Read full news article
Patel Integrated Logistics Ltd is Rated Sell
Patel Integrated Logistics Ltd is rated 'Sell' by MarketsMOJO, with this rating last updated on 12 May 2026. However, the analysis and financial metrics discussed here reflect the stock's current position as of 03 June 2026, providing investors with the most up-to-date view of the company’s fundamentals, returns, and technical outlook.
Read full news article Announcements
Board Meeting Intimation for Patel Integrated Logistics Ltd Has Informed BSE That The Meeting Of The Board Of Directors Of The Company Is Scheduled On 23/06/2026 Inter Alia To Consider And Approve Proposal For Buyback Of Fully Paid Equity Shares Of The C
18-Jun-2026 | Source : BSEPatel Integrated Logistics Ltd-has informed BSE that the meeting of the Board of Directors of the Company is scheduled on 23/06/2026 inter alia to consider and approve Patel Integrated logistics Ltd has informed BSE that the meeting of the Board of Directors of the Company is scheduled on 23/06/2026 inter alia to consider and approve proposal for Buyback of fully paid Equity Shares of the Company
Disclosures under Reg. 29(2) of SEBI (SAST) Regulations 2011
15-Jun-2026 | Source : BSEThe Exchange has received the disclosure under Regulation 29(2) of SEBI (Substantial Acquisition of Shares & Takeovers) Regulations 2011 for Asgar Patel & Others
Disclosures under Reg. 29(2) of SEBI (SAST) Regulations 2011
11-Jun-2026 | Source : BSEThe Exchange has received the disclosure under Regulation 29(2) of SEBI (Substantial Acquisition of Shares & Takeovers) Regulations 2011 for Asgar Patel & Others
Corporate Actions

No Upcoming Board Meetings

Patel Integrated Logistics Ltd has declared 3% dividend, ex-date: 01 Sep 25

No Splits history available

No Bonus history available

Patel Integrated Logistics Ltd has announced 8:103 rights issue, ex-date: 06 Sep 24
Quality key factors
Valuation key factors
Technicals key factors
 Technical Indicator Scale: Bearish, Mildly Bearish, Sideways, Mildly Bullish, Bullish Turned
 Shareholding Snapshot : Mar 2026
Shareholding Compare (%holding)
Non Institution
None
Held by 0 Schemes
Held by 0 FIIs
Patel Holdings Limited (13.37%)
None
56.79%
Quarterly Results Snapshot (Standalone) - Mar'26 - QoQ

QoQ Growth in quarter ended Mar 2026 is 9.34% vs -6.11% in Dec 2025

QoQ Growth in quarter ended Mar 2026 is 11.15% vs 17.98% in Dec 2025
Half Yearly Results Snapshot (Standalone) - Sep'25
Growth in half year ended Sep 2025 is 3.46% vs 30.07% in Sep 2024
Growth in half year ended Sep 2025 is 10.11% vs 49.58% in Sep 2024
Nine Monthly Results Snapshot (Standalone) - Dec'25
YoY Growth in nine months ended Dec 2025 is 1.72% vs 25.09% in Dec 2024
YoY Growth in nine months ended Dec 2025 is 15.16% vs 48.32% in Dec 2024
Annual Results Snapshot (Consolidated) - Mar'26
Not Applicable: The company has declared_date for only one period
Not Applicable: The company has declared_date for only one period
About Patel Integrated Logistics Ltd

Company Coordinates


