
Key Events This Week
May 7: Q4 FY26 results reveal mounting losses and operational crisis
May 8: Financial trend deteriorates further amid market underperformance
May 8: Stock closes at Rs.6.63, down 3.91% for the week
Jul 22, 03:30 PM
BSE+NSE Vol: 8512
Miscellaneous
INR 8 Cr (Micro Cap)
NA (Loss Making)
37
0.00%
-1.18
4.85%
-0.53
Triveni Glass for the last several years.

May 7: Q4 FY26 results reveal mounting losses and operational crisis
May 8: Financial trend deteriorates further amid market underperformance
May 8: Stock closes at Rs.6.63, down 3.91% for the week
Triveni Glass Ltd's latest financial results for Q4 FY26 present a concerning picture of the company's operational status. The company reported zero revenue for the seventh consecutive quarter, indicating a complete cessation of business operations. This stark absence of sales reflects a significant decline from the ₹59.00 crores in annual sales recorded in FY20, marking a catastrophic 100% drop. In terms of financial performance, Triveni Glass recorded a net loss of ₹0.27 crores in Q4 FY26, which represents a sequential deterioration from a loss of ₹0.17 crores in Q3 FY26. The operating loss for the quarter was ₹0.36 crores, the highest in recent history, suggesting escalating operational challenges. Employee costs continued despite the lack of revenue, further straining the company's financial resources. The company's balance sheet reveals negative shareholder equity of ₹14.72 crores, with a book value ...
Read full news article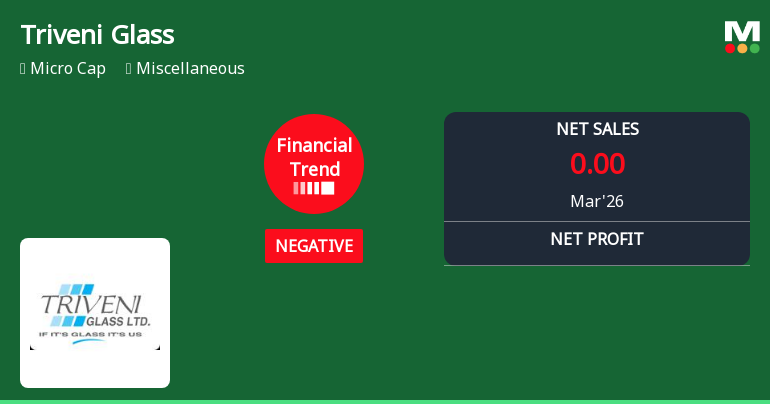
Triveni Glass Ltd has reported a marked decline in its financial performance for the quarter ended March 2026, signalling a shift from a previously flat trend to a distinctly negative trajectory. Key metrics such as return on capital employed (ROCE), earnings per share (EPS), and profitability indicators have all deteriorated, raising concerns about the company’s operational health and future prospects amid a challenging market environment.
Read full news articleThe certificate under regulation 74(5) of SEBI LODR is enclosed herewith .
The trading window for dealing in shares of the company shall be closed from 01.07.2026 till 48 hours of declaration of unaudited financial results for Quarter ending June 2026 by the board of directors . The date of board meeting shall be informed in due course . The trading window shall remain closed for directors promoters and designated persons including the KMP.
The Annual secretarial compliance report for the FY 2025 26 is enclosed.

No Upcoming Board Meetings

No Dividend history available

No Splits history available

No Bonus history available

No Rights history available
 Technical Indicator Scale: Bearish, Mildly Bearish, Sideways, Mildly Bullish, Bullish Turned
 Non Institution
None
Held by 4 Schemes (0.05%)
Held by 1 FIIs (2.76%)
Jitendra Kumar Agrawal (2.0%)
Mahendra Girdharilal (4.14%)
66.83%
QoQ Growth in quarter ended Mar 2026 is 0.00% vs 0.00% in Dec 2025

QoQ Growth in quarter ended Mar 2026 is -58.82% vs 29.17% in Dec 2025
Growth in half year ended Sep 2025 is 0.00% vs 0.00% in Sep 2024
Growth in half year ended Sep 2025 is -196.88% vs -76.12% in Sep 2024
YoY Growth in nine months ended Dec 2025 is 0.00% vs 0.00% in Dec 2024
YoY Growth in nine months ended Dec 2025 is -308.70% vs -84.67% in Dec 2024
YoY Growth in year ended Mar 2026 is 0.00% vs 0.00% in Mar 2025
YoY Growth in year ended Mar 2026 is -933.33% vs -96.86% in Mar 2025


