
Compare Orient Cement with Similar Stocks
Stock DNA
Cement & Cement Products
INR 2,832 Cr (Small Cap)
8.00
33
0.74%
0.02
15.96%
1.30
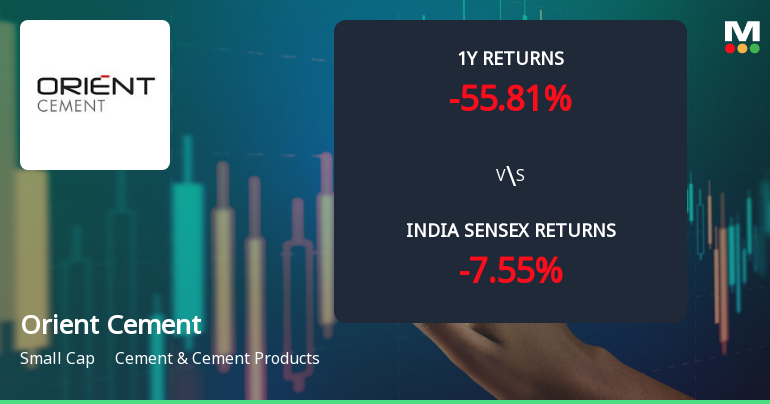
Total Returns (Price + Dividend) 
Latest dividend: 0.49833702882483366 per share ex-dividend date: Jun-12-2026
Risk Adjusted Returns v/s
Returns Beta

News
Orient Cement Ltd. Technical Momentum Shifts Amid Bearish Market Sentiment
Orient Cement Ltd. has experienced a notable shift in its technical momentum, moving from a bearish stance to a mildly bearish trend as of mid-June 2026. Despite a recent day gain of 3.73%, the stock’s broader technical indicators present a mixed picture, reflecting cautious optimism tempered by persistent downward pressures in the cement sector.
Read full news article
Orient Cement Ltd. is Rated Sell
Orient Cement Ltd. is rated 'Sell' by MarketsMOJO, with this rating last updated on 29 April 2026. However, the analysis and financial metrics discussed here reflect the stock's current position as of 12 June 2026, providing investors with an up-to-date view of the company’s performance and outlook.
Read full news article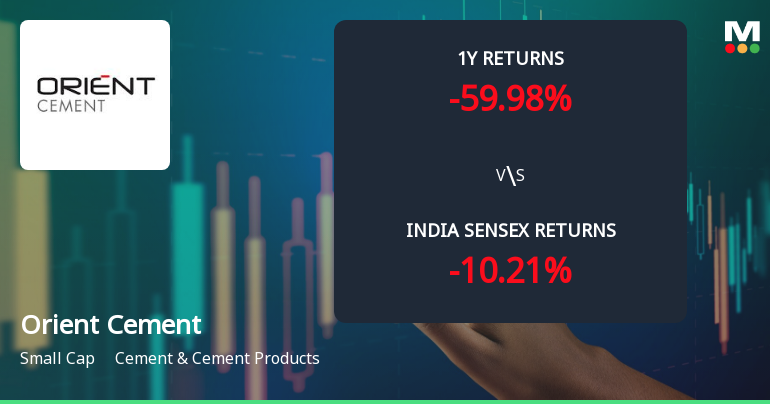
Orient Cement Ltd. Faces Bearish Momentum Amid Technical Downgrade
Orient Cement Ltd. has experienced a notable shift in its technical momentum, with key indicators signalling a transition from mildly bearish to a more pronounced bearish trend. Despite some mixed signals from monthly and weekly oscillators, the overall technical landscape suggests caution for investors amid ongoing price weakness and underperformance relative to the broader market.
Read full news article Announcements
Announcement under Regulation 30 (LODR)-Analyst / Investor Meet - Intimation
11-Jun-2026 | Source : BSEThe Company has informed the exchange about interaction with Investors / Analysts on June 16 2026 and June 17 2026.
Announcement under Regulation 30 (LODR)-Newspaper Publication
04-Jun-2026 | Source : BSENewspaper Publication - Notice to shareholders for compulsory transfer of equity shares to IEPF Account
Announcement under Regulation 30 (LODR)-Scheme of Arrangement
04-Jun-2026 | Source : BSEReceipt of observation letters with no adverse objection from the BSE Limited and no objection from the National Stock Exchange of India Limited in relation to the Scheme of Amalgamation of Orient Cement Limited (Transferor Company) with Ambuja Cements Limited (Transferee Company)
Corporate Actions

No Upcoming Board Meetings

Orient Cement Ltd. has declared 50% dividend, ex-date: 12 Jun 26

No Splits history available

No Bonus history available

No Rights history available
Quality key factors
Valuation key factors
Technicals key factors
 Technical Indicator Scale: Bearish, Mildly Bearish, Sideways, Mildly Bullish, Bullish Turned
 Shareholding Snapshot : Mar 2026
Shareholding Compare (%holding)
Promoters
None
Held by 7 Schemes (0.11%)
Held by 65 FIIs (4.7%)
Ambuja Cements Limited (72.66%)
Birla Institute Of Technology And Science (1.71%)
14.18%
Quarterly Results Snapshot (Standalone) - Mar'26 - YoY

YoY Growth in quarter ended Mar 2026 is -21.57% vs -7.08% in Mar 2025

YoY Growth in quarter ended Mar 2026 is 31.76% vs -38.31% in Mar 2025
Half Yearly Results Snapshot (Standalone) - Sep'25
Growth in half year ended Sep 2025 is 21.73% vs -19.76% in Sep 2024
Growth in half year ended Sep 2025 is 551.79% vs -36.69% in Sep 2024
Nine Monthly Results Snapshot (Standalone) - Dec'25
YoY Growth in nine months ended Dec 2025 is 13.92% vs -18.00% in Dec 2024
YoY Growth in nine months ended Dec 2025 is 473.93% vs -53.89% in Dec 2024
Annual Results Snapshot (Standalone) - Mar'26
YoY Growth in year ended Mar 2026 is 3.11% vs -14.95% in Mar 2025
YoY Growth in year ended Mar 2026 is 270.07% vs -47.81% in Mar 2025
About Orient Cement Ltd.

Company Coordinates


