
Compare Veedol Corporat with Similar Stocks
Total Returns (Price + Dividend) 
Latest dividend: 14.035532994923859 per share ex-dividend date: Feb-06-2026
Risk Adjusted Returns v/s
Returns Beta

News
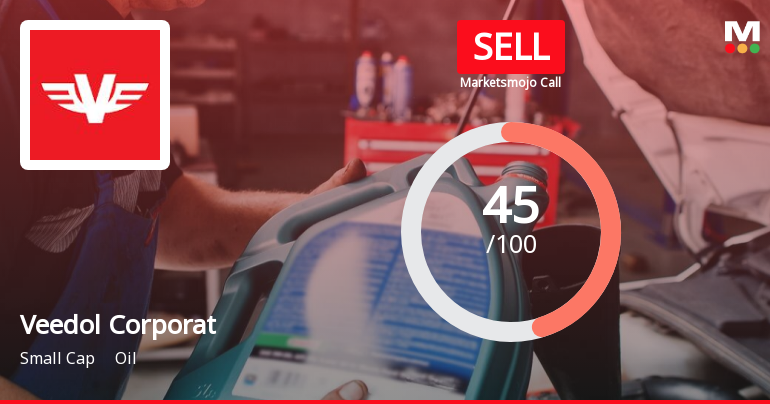
Veedol Corporation Ltd is Rated Sell
Veedol Corporation Ltd is rated Sell by MarketsMOJO, with this rating last updated on 12 January 2026. However, the analysis and financial metrics discussed here reflect the company’s current position as of 18 June 2026, providing investors with an up-to-date view of its fundamentals, returns, and market standing.
Read full news article
Veedol Corporation Ltd is Rated Sell
Veedol Corporation Ltd is rated 'Sell' by MarketsMOJO, with this rating last updated on 12 January 2026. However, the analysis and financial metrics discussed here reflect the stock's current position as of 08 June 2026, providing investors with the latest insights into the company’s performance and outlook.
Read full news article
Veedol Corporation Ltd is Rated Sell
Veedol Corporation Ltd is rated Sell by MarketsMOJO, with this rating last updated on 12 Jan 2026. However, the analysis and financial metrics discussed here reflect the stock’s current position as of 08 June 2026, providing investors with an up-to-date view of the company’s fundamentals, returns, and market standing.
Read full news article Announcements
Announcement under Regulation 30 (LODR)-Newspaper Publication
22-May-2026 | Source : BSEVeedol Corporation Limited has informed the Exchange about Copies of Newspaper Publications in respect of publication of the Extract of the Audited Financial Results of the Company for the quarter and year ended 31st March 2026 and Notice to Shareholders regarding Fixation of Record Date for payment of the Final Dividend for FY 2025-26.
Compliances-Reg.24(A)-Annual Secretarial Compliance
21-May-2026 | Source : BSESubmission of Annual Secretarial Compliance Report for the FY 2025-26
Intimation Of Record Date For The Purpose Of Final Dividend 2025-26
20-May-2026 | Source : BSEVeedol Corporation Limited has informed the exchange the record date as 17th July 2026 for the purpose of Final Dividend for the year 2025-26
Corporate Actions

No Upcoming Board Meetings

Veedol Corporation Ltd has declared 1100% dividend, ex-date: 17 Jul 26

Veedol Corporation Ltd has announced 2:5 stock split, ex-date: 26 Jul 21

Veedol Corporation Ltd has announced 1:1 bonus issue, ex-date: 26 Jul 21

No Rights history available
Quality key factors
Valuation key factors
Technicals key factors
 Technical Indicator Scale: Bearish, Mildly Bearish, Sideways, Mildly Bullish, Bullish Turned
 Shareholding Snapshot : Mar 2026
Shareholding Compare (%holding)
Promoters
None
Held by 0 Schemes
Held by 52 FIIs (1.06%)
Standard Greases And Specialities Private Limited (38.59%)
Lici Asm Non Par (1.12%)
26.77%
Quarterly Results Snapshot (Consolidated) - Mar'26 - YoY

YoY Growth in quarter ended Mar 2026 is 14.04% vs 9.25% in Mar 2025

YoY Growth in quarter ended Mar 2026 is -3.75% vs 39.10% in Mar 2025
Half Yearly Results Snapshot (Consolidated) - Sep'25
Growth in half year ended Sep 2025 is 7.09% vs 0.76% in Sep 2024
Growth in half year ended Sep 2025 is 26.36% vs 7.98% in Sep 2024
Nine Monthly Results Snapshot (Consolidated) - Dec'25
YoY Growth in nine months ended Dec 2025 is 8.58% vs -0.47% in Dec 2024
YoY Growth in nine months ended Dec 2025 is 23.03% vs 9.06% in Dec 2024
Annual Results Snapshot (Consolidated) - Mar'26
YoY Growth in year ended Mar 2026 is 9.96% vs 2.05% in Mar 2025
YoY Growth in year ended Mar 2026 is 13.55% vs 18.06% in Mar 2025
About Veedol Corporation Ltd

Company Coordinates


