
Compare Hitech Corp. with Similar Stocks
Dashboard
Strong ability to service debt as the company has a low Debt to EBITDA ratio of 2.12 times
Poor long term growth as Operating profit has grown by an annual rate -5.31% of over the last 5 years
With ROCE of 6.4, it has a Fair valuation with a 1.7 Enterprise value to Capital Employed
Despite the size of the company, domestic mutual funds hold only 0% of the company
Market Beating Performance
Total Returns (Price + Dividend) 
Latest dividend: 1 per share ex-dividend date: Jul-18-2025
Risk Adjusted Returns v/s
Returns Beta

News
Hitech Corporation Ltd is Rated Hold
Hitech Corporation Ltd is rated 'Hold' by MarketsMOJO, with this rating last updated on 29 May 2026. However, the analysis and financial metrics discussed here reflect the stock's current position as of 26 July 2026, providing investors with an up-to-date view of the company’s fundamentals, valuation, financial trends, and technical outlook.
Read full news article
Hitech Corporation Ltd Technical Momentum Shifts Signal Bullish Outlook
Hitech Corporation Ltd, a micro-cap player in the packaging sector, has witnessed a notable shift in its technical momentum, upgrading its technical trend from mildly bullish to bullish. This change is supported by a confluence of positive signals from key indicators such as MACD, Bollinger Bands, and moving averages, despite some bearish cues from RSI. The stock’s recent performance and technical parameters suggest a cautiously optimistic outlook for investors.
Read full news article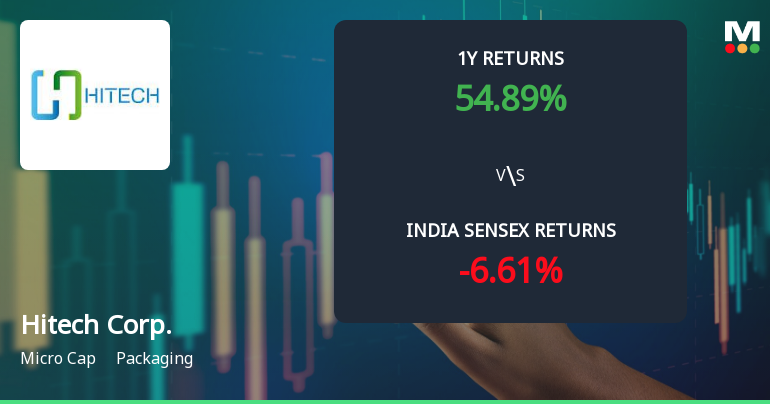
Hitech Corporation Ltd Technical Momentum Shifts Amid Mixed Indicator Signals
Hitech Corporation Ltd, a micro-cap player in the packaging sector, has recently experienced a nuanced shift in its technical momentum, moving from a bullish to a mildly bullish trend. Despite a slight dip in the daily price, the stock’s technical indicators present a complex picture, with bullish signals on some fronts and bearish tendencies on others, prompting a Hold rating upgrade from Sell by MarketsMOJO as of 29 May 2026.
Read full news article Announcements
Announcement under Regulation 30 (LODR)-Newspaper Publication
22-Jul-2026 | Source : BSEPlease find enclosed clippings of the Notice published about the intention of the Company to make an application to the Central Government for its approval for reappointment of Mr. Malav Ashwin Dani a Non Resident Indian as Managing Director of the Company for a period of five years effective from August 05 2026.
Announcement under Regulation 30 (LODR)-Change in Management
10-Jul-2026 | Source : BSEIn accordance with Regulation 30 read with Para A of Part A of Schedule III of the SEBI (Listing Obligations and Disclosure Requirements) Regulations 2015 shareholders approval was sought for re-appointment of Mr. Malav Dani as Managing Director w.e.f. 5th Aug 2026 subject to Central Government approval and appointment of Mr. Mehli Golvala as Independent Director. The results of postal ballot were announced today and the shareholders have approved the resolutions with requisite majority. The brief profiles of both the Directors are attached as Annexure A to the intimation. Kindly take this on record.
Shareholder Meeting / Postal Ballot-Outcome of Postal_Ballot
10-Jul-2026 | Source : BSEOutcome of the Postal Ballot E-voting Results under Regulation 30 and 44(3) of the SEBI (LODR) Regulations 2015 and 11(4) of the SEBI (Delisting of Equity Shares) Regulations 2021 is attached. All the resolutions have been passed with requisite majority and deemed to pass on the last date of voting i.e. 10th July 2026. We hereby enclose - Voting Results and Scrutinizer Report. Kindly take the same on your record.
Corporate Actions

No Upcoming Board Meetings

Hitech Corporation Ltd has declared 10% dividend, ex-date: 18 Jul 25

No Splits history available

No Bonus history available

No Rights history available
Quality key factors
Valuation key factors
Technicals key factors
 Technical Indicator Scale: Bearish, Mildly Bearish, Sideways, Mildly Bullish, Bullish Turned
 Shareholding Snapshot : Jun 2026
Shareholding Compare (%holding)
Promoters
None
Held by 0 Schemes
Held by 1 FIIs (0.0%)
Geetanjali Trading And Investments Private Limited (69.11%)
Rajen Anil Shah (1.37%)
17.97%
Quarterly Results Snapshot (Standalone) - Mar'26 - QoQ

QoQ Growth in quarter ended Mar 2026 is 15.26% vs -11.29% in Dec 2025
QoQ Growth in quarter ended Mar 2026 is 295.11% vs -316.56% in Dec 2025
Half Yearly Results Snapshot (Consolidated) - Sep'25
Not Applicable: The company has declared_date for only one period
Not Applicable: The company has declared_date for only one period
Nine Monthly Results Snapshot (Consolidated) - Dec'25
Not Applicable: The company has declared_date for only one period
Not Applicable: The company has declared_date for only one period
Annual Results Snapshot (Consolidated) - Mar'26
Not Applicable: The company has declared_date for only one period
Not Applicable: The company has declared_date for only one period
About Hitech Corporation Ltd

Company Coordinates


