
Compare Dwarikesh Sugar with Similar Stocks
Dashboard
Poor long term growth as Net Sales has grown by an annual rate of -5.28% and Operating profit at -20.74% over the last 5 years
Flat results in Jun 26
With ROCE of 4.4, it has a Very Attractive valuation with a 0.9 Enterprise value to Capital Employed
Despite the size of the company, domestic mutual funds hold only 0% of the company
Consistent Underperformance against the benchmark over the last 3 years
Total Returns (Price + Dividend) 
Latest dividend: 0.5 per share ex-dividend date: Aug-12-2025
Risk Adjusted Returns v/s
Returns Beta

News
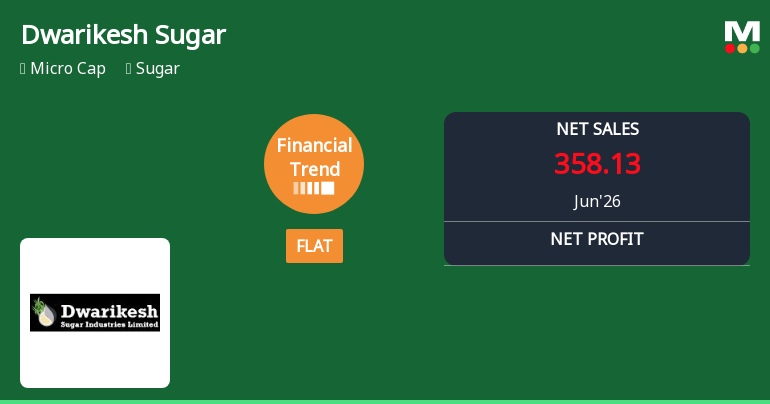
Dwarikesh Sugar Industries Ltd Reports Flat Quarterly Performance Amid Margin Pressures
Dwarikesh Sugar Industries Ltd has reported a flat financial performance for the quarter ended June 2026, marking a significant shift from its previously positive growth trajectory. Despite a higher profit after tax (PAT) over the last six months, the company’s quarterly earnings and profitability metrics have deteriorated sharply, reflecting mounting challenges in the sugar sector and operational pressures.
Read full news article
Dwarikesh Sugar Industries Ltd is Rated Hold
Dwarikesh Sugar Industries Ltd is rated 'Hold' by MarketsMOJO, with this rating last updated on 15 June 2026. While the rating was revised on that date, the analysis and financial metrics discussed here reflect the stock's current position as of 19 July 2026, providing investors with the latest insights into the company’s performance and outlook.
Read full news article
Dwarikesh Sugar Industries Ltd is Rated Hold by MarketsMOJO
Dwarikesh Sugar Industries Ltd is rated 'Hold' by MarketsMOJO, with this rating last updated on 15 June 2026. However, the analysis and financial metrics discussed here reflect the company’s current position as of 08 July 2026, providing investors with an up-to-date perspective on the stock’s fundamentals, valuation, financial trends, and technical outlook.
Read full news article Announcements
Board Meeting Intimation for Intimation Of Meeting Of Board Of Directors Of The Company.
21-Jul-2026 | Source : BSEDwarikesh Sugar Industries Ltdhas informed BSE that the meeting of the Board of Directors of the Company is scheduled on 28/07/2026 inter alia to consider and approve We wish to inform you that pursuant to Regulation 29(1) of the SEBI (Listing Obligation and Disclosure Requirement) Regulations 2015 a Meeting of Board of Directors of the Company is scheduled to be held on Tuesday July 28 2026 through video conferencing (VC) to consider inter alia the following businesses: 1. To consider take on record & approve Unaudited Financial Results along with Limited Review Report for the quarter ended June 30 2026; 2. Any other matter with permission of the Chair; You are kindly requested to bring this information to the notice of all concerned.
Announcement under Regulation 30 (LODR)-Newspaper Publication
11-Jul-2026 | Source : BSEAs per attachment
Reg. 34 (1) Annual Report.
10-Jul-2026 | Source : BSEAs per attachment
Corporate Actions

No Upcoming Board Meetings

Dwarikesh Sugar Industries Ltd has declared 10% dividend, ex-date: 30 Jul 26

Dwarikesh Sugar Industries Ltd has announced 1:10 stock split, ex-date: 10 Aug 17

No Bonus history available

No Rights history available
Quality key factors
Valuation key factors
Technicals key factors
 Technical Indicator Scale: Bearish, Mildly Bearish, Sideways, Mildly Bullish, Bullish Turned
 Shareholding Snapshot : Jun 2026
Shareholding Compare (%holding)
Non Institution
None
Held by 0 Schemes
Held by 26 FIIs (1.01%)
Gautam Radheshyam Morarka (15.22%)
None
49.71%
Quarterly Results Snapshot (Standalone) - Jun'26 - QoQ

QoQ Growth in quarter ended Jun 2026 is -15.82% vs 30.85% in Mar 2026
QoQ Growth in quarter ended Jun 2026 is -144.82% vs 271.83% in Mar 2026
Half Yearly Results Snapshot (Standalone) - Sep'25

Growth in half year ended Sep 2025 is 10.91% vs -42.23% in Sep 2024
Growth in half year ended Sep 2025 is -24.58% vs -166.27% in Sep 2024
Nine Monthly Results Snapshot (Standalone) - Dec'25
YoY Growth in nine months ended Dec 2025 is 8.50% vs -32.31% in Dec 2024
YoY Growth in nine months ended Dec 2025 is -15.57% vs -137.88% in Dec 2024
Annual Results Snapshot (Standalone) - Mar'26
YoY Growth in year ended Mar 2026 is 3.17% vs -20.51% in Mar 2025
YoY Growth in year ended Mar 2026 is 32.13% vs -72.05% in Mar 2025
About Dwarikesh Sugar Industries Ltd

Company Coordinates


