
Compare Jyoti with Similar Stocks
Dashboard
With a Negative Book Value, the company has a Weak Long Term Fundamental Strength
- Poor long term growth as Net Sales has grown by an annual rate of 19.18% and Operating profit at 0% over the last 5 years
- The company has a negative book value of Rs 21.04 crore
Flat results in Mar 26
Risky - Negative Book Value
97.41% of Promoter Shares are Pledged
Underperformed the market in the last 1 year
Stock DNA
Heavy Electrical Equipment
INR 143 Cr (Micro Cap)
8.00
46
0.00%
-7.87
-85.49%
-6.73
Total Returns (Price + Dividend) 
Latest dividend: 1 per share ex-dividend date: Sep-11-2012
Risk Adjusted Returns v/s
Returns Beta

News

Jyoti Ltd is Rated Strong Sell
Jyoti Ltd is rated Strong Sell by MarketsMOJO, with this rating last updated on 01 September 2025. However, the analysis and financial metrics discussed here reflect the company’s current position as of 15 June 2026, providing investors with an up-to-date view of the stock’s fundamentals, returns, and technical outlook.
Read full news article
Jyoti Ltd is Rated Strong Sell
Jyoti Ltd is rated Strong Sell by MarketsMOJO, with this rating last updated on 01 September 2025. However, the analysis and financial metrics discussed here reflect the company’s current position as of 01 June 2026, providing investors with the latest insights into its performance and outlook.
Read full news article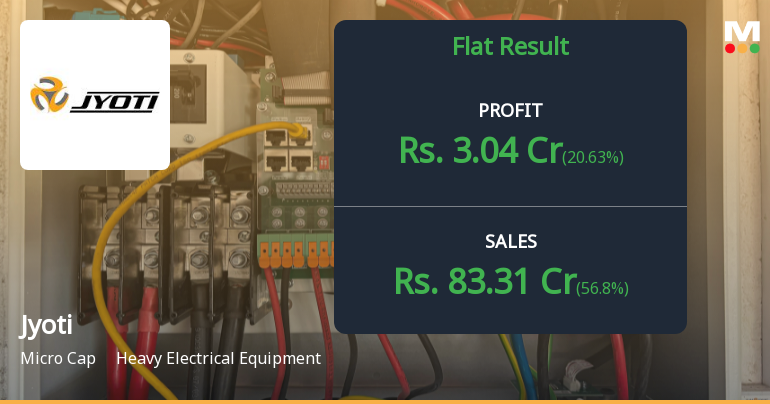
Jyoti Ltd Q4 FY26: Profitability Collapses Amid Tax Shock and Margin Pressure
Jyoti Ltd., a Vadodara-based heavy electrical equipment manufacturer, delivered a deeply disappointing fourth quarter for FY26, with consolidated net profit plummeting 62.88% year-on-year to ₹3.04 crores despite a modest revenue recovery. The stock has reacted brutally to the results, trading at ₹63.13 as of May 29, down 52.53% from its 52-week high of ₹133.00, and extending losses to 43.73% over the past year. With a market capitalisation of just ₹145.78 crores and negative book value, the micro-cap company faces mounting questions about its financial viability and operational sustainability.
Read full news article Announcements
Announcement under Regulation 30 (LODR)-Newspaper Publication
04-Jun-2026 | Source : BSEIntimation to the concerned shareholders for claiming the shares from Unclaimed suspense account
Copy Of Final Reminder Letter Sent To The Concerned Shareholders For Claiming Shares From Unclaimed Suspense Account
03-Jun-2026 | Source : BSECopy of final reminder letter
Announcement under Regulation 30 (LODR)-Newspaper Publication
29-May-2026 | Source : BSEAudited Financial Results as on 31.03.2026
Corporate Actions

No Upcoming Board Meetings

Jyoti Ltd has declared 10% dividend, ex-date: 11 Sep 12

No Splits history available

No Bonus history available

No Rights history available
Quality key factors
Valuation key factors
Technicals key factors
 Technical Indicator Scale: Bearish, Mildly Bearish, Sideways, Mildly Bullish, Bullish Turned
 Shareholding Snapshot : Mar 2026
Shareholding Compare (%holding)
Non Institution
97.4127
Held by 1 Schemes (0.0%)
Held by 0 FIIs
Insutech Industries Limited (10.12%)
Rare Asset Reconstruction Limited (25.82%)
34.52%
Quarterly Results Snapshot (Consolidated) - Mar'26 - QoQ

QoQ Growth in quarter ended Mar 2026 is 56.80% vs -25.15% in Dec 2025
QoQ Growth in quarter ended Mar 2026 is 20.63% vs -60.99% in Dec 2025
Half Yearly Results Snapshot (Consolidated) - Sep'25
Growth in half year ended Sep 2025 is 64.99% vs 19.27% in Sep 2024

Growth in half year ended Sep 2025 is 202.91% vs 274.55% in Sep 2024
Nine Monthly Results Snapshot (Consolidated) - Dec'25
YoY Growth in nine months ended Dec 2025 is 41.22% vs 21.13% in Dec 2024
YoY Growth in nine months ended Dec 2025 is 86.57% vs 262.16% in Dec 2024
Annual Results Snapshot (Consolidated) - Mar'26
YoY Growth in year ended Mar 2026 is 12.91% vs 39.67% in Mar 2025
YoY Growth in year ended Mar 2026 is 11.15% vs 92.30% in Mar 2025
About Jyoti Ltd

Company Coordinates


