
Compare Satchmo Holdings with Similar Stocks
Dashboard
Weak Long Term Fundamental Strength with a -24.70% CAGR growth in Net Sales over the last 5 years
- Company's ability to service its debt is weak with a poor EBIT to Interest (avg) ratio of -16.75
- The company has been able to generate a Return on Equity (avg) of 4.90% signifying low profitability per unit of shareholders funds
With a growth in Net Sales of 459.19%, the company declared Outstanding results in Mar 26
With ROE of 14.7, it has a Attractive valuation with a 0.6 Price to Book Value
Falling Participation by Institutional Investors
Stock DNA
Diversified Commercial Services
INR 70 Cr (Micro Cap)
4.00
38
0.00%
-0.05
14.71%
0.64
Total Returns (Price + Dividend) 
Latest dividend: 0.3 per share ex-dividend date: Sep-22-2011
Risk Adjusted Returns v/s
Returns Beta

News
Satchmo Holdings Ltd is Rated Hold
Satchmo Holdings Ltd is rated Hold by MarketsMOJO, with this rating last updated on 25 June 2026. However, the analysis and financial metrics discussed here reflect the company’s current position as of 07 July 2026, providing investors with the latest insights into its performance and outlook.
Read full news article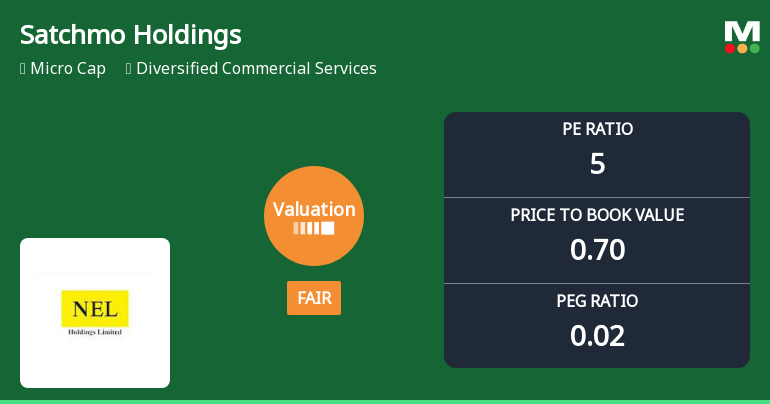
Satchmo Holdings Ltd Valuation Shifts: From Very Attractive to Fair Amid Market Dynamics
Satchmo Holdings Ltd, a micro-cap player in the diversified commercial services sector, has witnessed a notable shift in its valuation parameters, moving from a very attractive to a fair valuation grade. This change reflects evolving market perceptions and comparative peer analysis, despite the company’s robust returns relative to the broader Sensex index over multiple time horizons.
Read full news article
Satchmo Holdings Ltd Downgraded to Hold Amid Mixed Financial and Technical Signals
Satchmo Holdings Ltd, a micro-cap player in the diversified commercial services sector, has seen its investment rating downgraded from Buy to Hold as of 25 June 2026. This adjustment reflects a nuanced reassessment across four key parameters: quality, valuation, financial trend, and technical indicators. While the company continues to demonstrate strong recent financial performance and market-beating returns, evolving technical signals and a shift in valuation metrics have prompted a more cautious stance.
Read full news article Announcements
Shareholder Meeting / Postal Ballot-Scrutinizers Report
30-Jun-2026 | Source : BSESATCHMO HOLDINGS LIMITED - Voting Results and Scrutinizers report of the 22nd Annual General Meeting
Shareholder Meeting / Postal Ballot-Outcome of AGM
30-Jun-2026 | Source : BSESATCHMO HOLDINGS LIMITED - Outcome of the AGM proceedings held on 30th June 2026 at 09:00 AM
Announcement Under Regulation 30 Of SEBI (LODR) 2025 - Updates
30-Jun-2026 | Source : BSE1. Re-appointed Mr. L S Vaidyanathan (DIN:00304652) as Whole Time Executive Director with effect from 1st June 2026 for a period of 14 months. 2. Re-appointed Mr. Ramesh Karur Raghavendran (DIN: 03572425) by retired by rotation. 3. Approved for making Investment Loans Guarantees and providing Securities in Wholly Owned Subsidiary. 4. Approved Material Related Transactions under Regulation 23 to be entered during the financial year 2026-27 and up to the date of the next AGM.
Corporate Actions

No Upcoming Board Meetings

Satchmo Holdings Ltd has declared 3% dividend, ex-date: 22 Sep 11

No Splits history available

No Bonus history available

No Rights history available
Quality key factors
Valuation key factors
Technicals key factors
 Technical Indicator Scale: Bearish, Mildly Bearish, Sideways, Mildly Bullish, Bullish Turned
 Shareholding Snapshot : Mar 2026
Shareholding Compare (%holding)
Non Institution
None
Held by 0 Schemes
Held by 0 FIIs
Nitesh Shetty (44.76%)
Life Insurance Corporation Of India (4.26%)
42.16%
Quarterly Results Snapshot (Consolidated) - Mar'26 - QoQ

QoQ Growth in quarter ended Mar 2026 is 459.19% vs -64.01% in Dec 2025

QoQ Growth in quarter ended Mar 2026 is -98.99% vs 2,084.97% in Dec 2025
Half Yearly Results Snapshot (Consolidated) - Sep'25
Growth in half year ended Sep 2025 is 15.43% vs -75.08% in Sep 2024
Growth in half year ended Sep 2025 is 70.84% vs -3.59% in Sep 2024
Nine Monthly Results Snapshot (Consolidated) - Dec'25
YoY Growth in nine months ended Dec 2025 is 5.33% vs -69.09% in Dec 2024
YoY Growth in nine months ended Dec 2025 is 4,299.66% vs 557.49% in Dec 2024
Annual Results Snapshot (Consolidated) - Mar'26
YoY Growth in year ended Mar 2026 is 155.58% vs -73.14% in Mar 2025
YoY Growth in year ended Mar 2026 is 6,367.57% vs 16.33% in Mar 2025
About Satchmo Holdings Ltd


