
Compare V B Industries with Similar Stocks
Dashboard
With a Operating Losses, the company has a Weak Long Term Fundamental Strength
- Poor long term growth as Net Sales has grown by an annual rate of -7.75%
- PAT(Q) At Rs -0.90 cr has Fallen at -607.0% (vs previous 4Q average)
- PBDIT(Q) Lowest at Rs -1.65 cr.
- PBT LESS OI(Q) Lowest at Rs -1.65 cr.
With ROE of 0.1, it has a Very Expensive valuation with a 0.1 Price to Book Value
Underperformed the market in the last 1 year
Stock DNA
Non Banking Financial Company (NBFC)
INR 12 Cr (Micro Cap)
83.00
22
0.00%
0.00
0.15%
0.13
Total Returns (Price + Dividend) 
V B Industries for the last several years.
Risk Adjusted Returns v/s
Returns Beta

News

Golden Cross Forms in V B Industries Ltd — Mixed Technical Signals and Micro-Cap Caveats
The 50-day moving average has crossed above the 200-day moving average for V B Industries Ltd, signalling a golden cross on 16 Jul 2026. Yet, the broader technical picture is conflicted, with monthly momentum indicators bearish despite weekly signals turning positive. This micro-cap's recent price action and fundamental profile add further complexity to interpreting the crossover’s significance.
Read full news article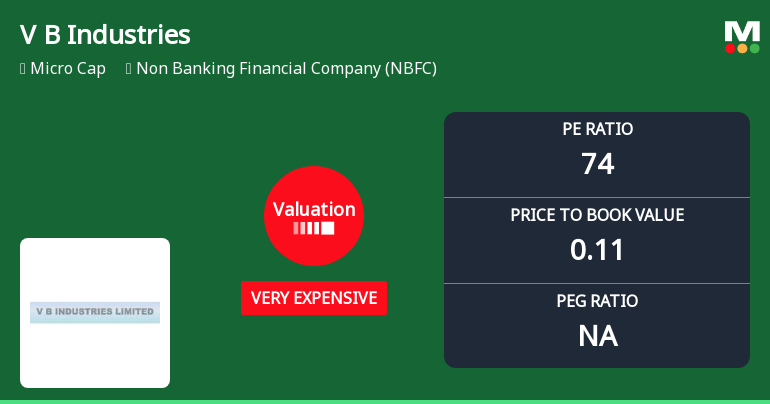
V B Industries Ltd Valuation Shifts Signal Heightened Price Risk Amid Mixed Returns
V B Industries Ltd, a micro-cap player in the Non Banking Financial Company (NBFC) sector, has recently undergone a significant shift in its valuation parameters, moving from an expensive to a very expensive rating. This article analyses the implications of these changes in price-to-earnings (P/E) and price-to-book value (P/BV) ratios, compares the company’s valuation with peers and historical benchmarks, and assesses the stock’s price attractiveness amid market volatility.
Read full news article
V B Industries Ltd Valuation Shifts Signal Price Attractiveness Concerns
V B Industries Ltd, a micro-cap player in the Non Banking Financial Company (NBFC) sector, has seen its valuation parameters shift notably, prompting a reassessment of its price attractiveness. Despite a stable share price at ₹7.40, the company’s price-to-earnings (P/E) ratio remains elevated at 69.28, while its price-to-book value (P/BV) has dropped to a mere 0.10, reflecting a complex valuation landscape that investors must carefully analyse.
Read full news article Announcements
Compliances-Certificate under Reg. 74 (5) of SEBI (DP) Regulations 2018
06-Jul-2026 | Source : BSEPlease find attached RTA Certificate u/r 74(5) for QE June 30 2026
Compliance-57 (5) : intimation after the end of quarter
06-Jul-2026 | Source : BSEPlease find attached declaration about non-applicability of Regulation 57(5) for QE June 30 2026
Compliance-57 (4) : Prior intimation to the beginning of the quarter
26-Jun-2026 | Source : BSEPlease find attached prior intimation letter about non-applicability of Regulation 57(4) for QE Sept 30 2026
Corporate Actions

No Upcoming Board Meetings

No Dividend history available

No Splits history available

No Bonus history available

No Rights history available
Quality key factors
Valuation key factors
Technicals key factors
 Technical Indicator Scale: Bearish, Mildly Bearish, Sideways, Mildly Bullish, Bullish Turned
 Shareholding Snapshot : Jun 2026
Shareholding Compare (%holding)
Non Institution
None
Held by 0 Schemes
Held by 0 FIIs
None
Gajmukh Trading Private Limited (4.17%)
65.47%
Quarterly Results Snapshot (Standalone) - Mar'26 - QoQ
QoQ Growth in quarter ended Mar 2026 is 0.00% vs 0.00% in Dec 2025

QoQ Growth in quarter ended Mar 2026 is -350.00% vs 0.00% in Dec 2025
Half Yearly Results Snapshot (Standalone) - Sep'25
Growth in half year ended Sep 2025 is 0.00% vs 0.00% in Sep 2024
Growth in half year ended Sep 2025 is -9.33% vs 33.93% in Sep 2024
Nine Monthly Results Snapshot (Standalone) - Dec'25
YoY Growth in nine months ended Dec 2025 is -100.00% vs 0.00% in Dec 2024

YoY Growth in nine months ended Dec 2025 is 92.59% vs -34.94% in Dec 2024
Annual Results Snapshot (Standalone) - Mar'26
YoY Growth in year ended Mar 2026 is 638.64% vs -48.84% in Mar 2025
YoY Growth in year ended Mar 2026 is 255.56% vs -212.50% in Mar 2025
About V B Industries Ltd

Company Coordinates


