
Compare D & H India with Similar Stocks
Dashboard
Healthy long term growth as Net Sales has grown by an annual rate of 30.17% and Operating profit at 72.85%
The company has declared Positive results for the last 6 consecutive quarters
With ROCE of 13.5, it has a Attractive valuation with a 2.8 Enterprise value to Capital Employed
Majority shareholders : Non Institution
Consistent Returns over the last 3 years
Stock DNA
Industrial Manufacturing
INR 255 Cr (Micro Cap)
32.00
41
0.00%
0.40
10.75%
3.34
Total Returns (Price + Dividend) 
Latest dividend: 0.46449999999999997 per share ex-dividend date: Sep-22-2015
Risk Adjusted Returns v/s
Returns Beta

News

D & H India Ltd is Rated Hold by MarketsMOJO
D & H India Ltd is rated 'Hold' by MarketsMOJO, with this rating last updated on 09 March 2026. While the rating change occurred in early March, the analysis and financial metrics discussed here reflect the company’s current position as of 11 June 2026, providing investors with an up-to-date view of the stock’s fundamentals, valuation, financial trends, and technical outlook.
Read full news article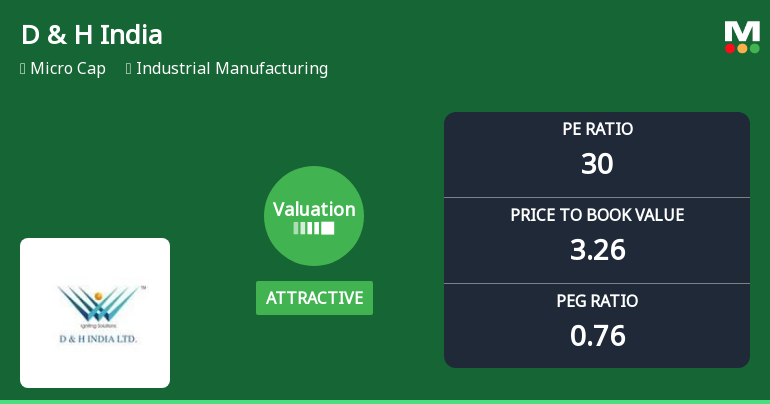
D & H India Ltd Valuation Shifts Signal Renewed Price Attractiveness
D & H India Ltd, a micro-cap player in the industrial manufacturing sector, has witnessed a notable shift in its valuation parameters, moving from an expensive to an attractive price territory. This change, reflected in key metrics such as the price-to-earnings (P/E) and price-to-book value (P/BV) ratios, comes amid strong stock performance relative to the broader market, signalling a potential re-rating by investors.
Read full news articleAre D & H India Ltd latest results good or bad?
D & H India Ltd's latest financial results for Q4 FY26 reveal a significant divergence between revenue growth and profitability challenges. The company reported net sales of ₹72.24 crores, marking a quarterly record and reflecting a 16.61% increase from the previous quarter and a 22.13% rise year-on-year. This robust top-line performance indicates strong demand in the industrial manufacturing sector. However, the net profit for the same quarter was ₹2.32 crores, which represents a decline of 26.11% compared to the previous quarter, despite a year-on-year increase of 14.85%. This decline in profit is attributed to various operational pressures, including increased employee costs, compressed gross profit margins, and a substantial rise in the effective tax rate. The operating margin, excluding other income, contracted to 6.60%, down from 9.56% in the previous quarter, while the profit after tax (PAT) margin...
Read full news article Announcements
Compliances-Reg.24(A)-Annual Secretarial Compliance
08-Jun-2026 | Source : BSEThis in continuation with our earlier submission of Annual Secretarial compliance Report for the year ended on 31.03.2026 filed on 29.05.2026. You are requested to please find enclosed the revised Annual secretarial compliance Report.
Announcement under Regulation 30 (LODR)-Newspaper Publication
30-May-2026 | Source : BSEDear sir Pursuant to Regulation 30 read with Schedule III Part A (A) and in compliance with Regulation 47(1)(b) of SEBI (LODR) Regulation 2015 regarding extract of Audited Consolidated Financial Result for the Quarter and Year ended on 31.03.2026 was approved in Metting of the Board of Director of the Company held on Friday 29th May 2026. we herewith enclosed the newspaper advertisement published on 30th May 2026 in Free Press English edition and Nav Shakti Marathi edition.
Compliances-Reg.24(A)-Annual Secretarial Compliance
30-May-2026 | Source : BSEDear Sir In compliance with Regulation 24A of the SEBI (LODR) Regulation 2015 and SEBI Master Circular Number SEBI/HO/CFD/PoD2/CIR/P/0155 dated 11th November 2024 we hereby submit the Annual Compliance Report for the Year ended 31.03.2026
Corporate Actions

No Upcoming Board Meetings

D & H India Ltd has declared 5% dividend, ex-date: 22 Sep 15

No Splits history available

No Bonus history available

D & H India Ltd has announced 1:4 rights issue, ex-date: 30 Jan 26
Quality key factors
Valuation key factors
Technicals key factors
 Technical Indicator Scale: Bearish, Mildly Bearish, Sideways, Mildly Bullish, Bullish Turned
 Shareholding Snapshot : Mar 2026
Shareholding Compare (%holding)
Non Institution
None
Held by 0 Schemes
Held by 0 FIIs
Saurabh Vora (16.5%)
Indo Thai Securities Limited (7.64%)
34.66%
Quarterly Results Snapshot (Consolidated) - Mar'26 - QoQ

QoQ Growth in quarter ended Mar 2026 is 16.61% vs -5.59% in Dec 2025

QoQ Growth in quarter ended Mar 2026 is -26.11% vs 98.73% in Dec 2025
Half Yearly Results Snapshot (Consolidated) - Sep'25
Growth in half year ended Sep 2025 is 25.05% vs 37.88% in Sep 2024
Growth in half year ended Sep 2025 is 102.78% vs 25.22% in Sep 2024
Nine Monthly Results Snapshot (Consolidated) - Dec'25
YoY Growth in nine months ended Dec 2025 is 20.33% vs 34.34% in Dec 2024
YoY Growth in nine months ended Dec 2025 is 93.61% vs 44.91% in Dec 2024
Annual Results Snapshot (Consolidated) - Mar'26
YoY Growth in year ended Mar 2026 is 20.84% vs 32.51% in Mar 2025
YoY Growth in year ended Mar 2026 is 62.72% vs 90.74% in Mar 2025
About D & H India Ltd

Company Coordinates


