
Compare Automotive Axles with Similar Stocks
Dashboard
High Management Efficiency with a high ROE of 16.78%
The company is Net-Debt Free
Healthy long term growth as Operating profit has grown by an annual rate 46.48%
Positive results in Mar 26
With ROE of 15.8, it has a Very Attractive valuation with a 2.5 Price to Book Value
Increasing Participation by Institutional Investors
Stock DNA
Auto Components & Equipments
INR 2,691 Cr (Small Cap)
16.00
37
1.72%
-0.35
15.79%
2.44
Total Returns (Price + Dividend) 
Latest dividend: 30.409773200394433 per share ex-dividend date: Aug-05-2025
Risk Adjusted Returns v/s
Returns Beta

News
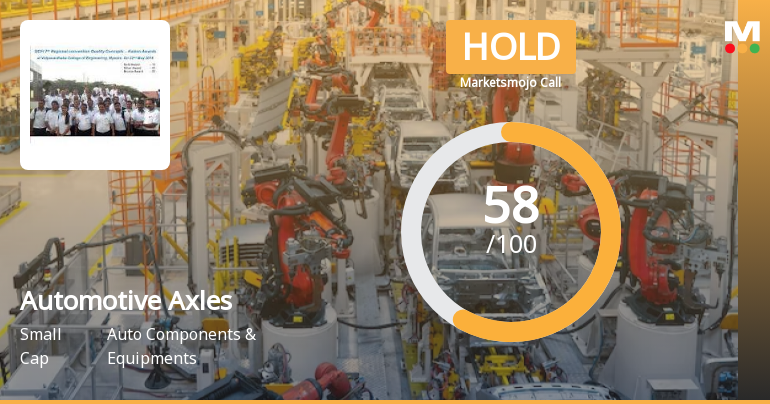
Automotive Axles Ltd is Rated Hold by MarketsMOJO
Automotive Axles Ltd is rated 'Hold' by MarketsMOJO, with this rating last updated on 20 May 2026. While the rating change occurred on that date, the analysis and financial metrics discussed here reflect the company’s current position as of 21 June 2026, providing investors with the most up-to-date view of the stock’s fundamentals, valuation, financial trends, and technical outlook.
Read full news article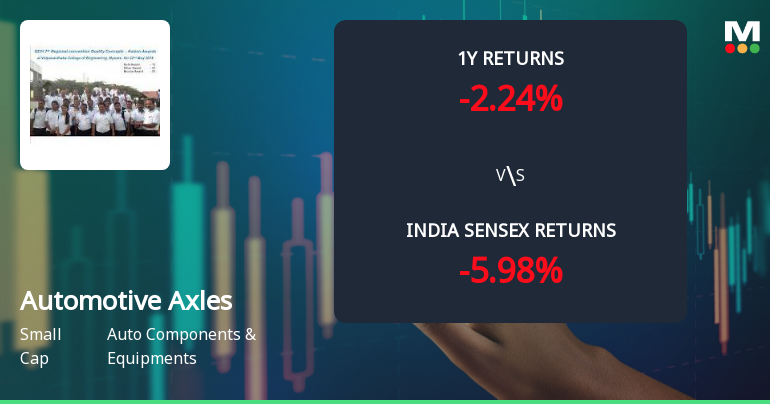
Automotive Axles Ltd Sees Technical Momentum Shift Amid Mixed Market Signals
Automotive Axles Ltd has experienced a notable shift in its technical momentum, moving from a bearish stance to a mildly bearish outlook, supported by a blend of mixed signals from key technical indicators. The stock’s recent price action, combined with evolving momentum metrics, suggests cautious optimism for investors amid a volatile auto components sector.
Read full news article
Automotive Axles Ltd is Rated Hold by MarketsMOJO
Automotive Axles Ltd is rated 'Hold' by MarketsMOJO, with this rating last updated on 20 May 2026. However, the analysis and financial metrics discussed here reflect the stock's current position as of 10 June 2026, providing investors with an up-to-date view of the company’s fundamentals, valuation, financial trends, and technical outlook.
Read full news article Announcements
Announcement under Regulation 30 (LODR)-Newspaper Publication
10-Jun-2026 | Source : BSENewspaper Publication - Notice to Shareholders w.r.t Special Window For Transfer and Dematerialisation (Demat) of Physical Securities.
Communication/Reminder Letters To Shareholders.
27-May-2026 | Source : BSECommunication / Reminder letters sent to the respective shareholders concerning the proposed transfer of their Unclaimed Dividend / Corresponding Shares of the FY 2018-19 and onwards to the IEPF Authority.
Announcement under Regulation 30 (LODR)-Newspaper Publication
27-May-2026 | Source : BSENewspaper Advertisement - Notice to Shareholders regarding Transfer of Unclaimed Dividend and corresponding shares of the Company for FY 2018-19 and onwards to the IEPFA.
Corporate Actions

No Upcoming Board Meetings

Automotive Axles Ltd has declared 305% dividend, ex-date: 05 Aug 25

No Splits history available

No Bonus history available

No Rights history available
Quality key factors
Valuation key factors
Technicals key factors
 Technical Indicator Scale: Bearish, Mildly Bearish, Sideways, Mildly Bullish, Bullish Turned
 Shareholding Snapshot : Mar 2026
Shareholding Compare (%holding)
Promoters
None
Held by 8 Schemes (15.02%)
Held by 44 FIIs (0.83%)
Bf Investment Limited (35.52%)
Nippon Life India Trustee Ltd (8.81%)
10.64%
Quarterly Results Snapshot (Standalone) - Mar'26 - YoY

YoY Growth in quarter ended Mar 2026 is 18.70% vs -2.08% in Mar 2025
YoY Growth in quarter ended Mar 2026 is 17.33% vs 4.15% in Mar 2025
Half Yearly Results Snapshot (Standalone) - Sep'25
Growth in half year ended Sep 2025 is -3.65% vs -11.57% in Sep 2024
Growth in half year ended Sep 2025 is 2.36% vs -15.53% in Sep 2024
Nine Monthly Results Snapshot (Standalone) - Dec'25
YoY Growth in nine months ended Dec 2025 is -0.29% vs -8.43% in Dec 2024
YoY Growth in nine months ended Dec 2025 is 0.80% vs -10.20% in Dec 2024
Annual Results Snapshot (Standalone) - Mar'26
YoY Growth in year ended Mar 2026 is 4.82% vs -6.80% in Mar 2025
YoY Growth in year ended Mar 2026 is 5.68% vs -6.39% in Mar 2025
About Automotive Axles Ltd

Company Coordinates


