
Compare Vardhman Concr. with Similar Stocks
Dashboard
With a Negative Book Value, the company has a Weak Long Term Fundamental Strength
- Poor long term growth as Net Sales has grown by an annual rate of 0% and Operating profit at 0% over the last 5 years
- High Debt Company with a Debt to Equity ratio (avg) at 0 times
Flat results in Sep 25
Risky - Negative Book Value
Below par performance in long term as well as near term
Stock DNA
Cement & Cement Products
INR 6 Cr (Micro Cap)
10.00
27
0.00%
-1.55
-5.80%
-0.55
Total Returns (Price + Dividend) 
Vardhman Concr. for the last several years.
Risk Adjusted Returns v/s
Returns Beta

News

Vardhman Concrete Ltd is Rated Strong Sell
Vardhman Concrete Ltd is rated Strong Sell by MarketsMOJO, with this rating last updated on 28 July 2025. However, the analysis and financial metrics discussed here reflect the stock’s current position as of 26 December 2025, providing investors with an up-to-date view of the company’s fundamentals, valuation, financial trends, and technical outlook.
Read full news article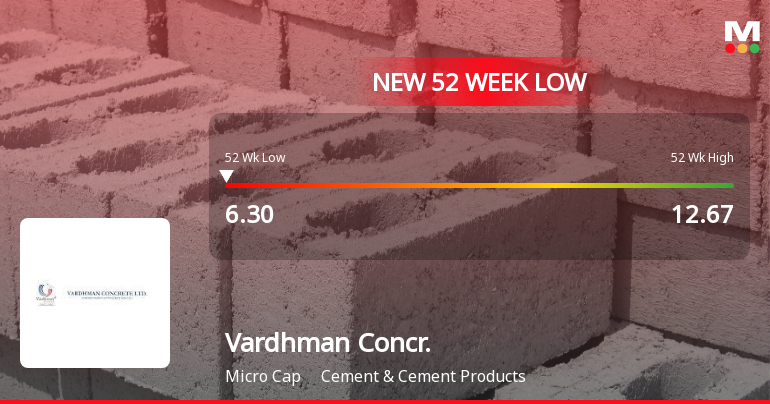
Vardhman Concrete Falls to 52-Week Low of Rs.6.3 Amid Prolonged Downtrend
Vardhman Concrete has reached a new 52-week low of Rs.6.3, marking a significant decline amid a sustained downward trend over the past twelve trading sessions. The stock’s performance contrasts sharply with the broader market, which continues to show resilience.
Read full news article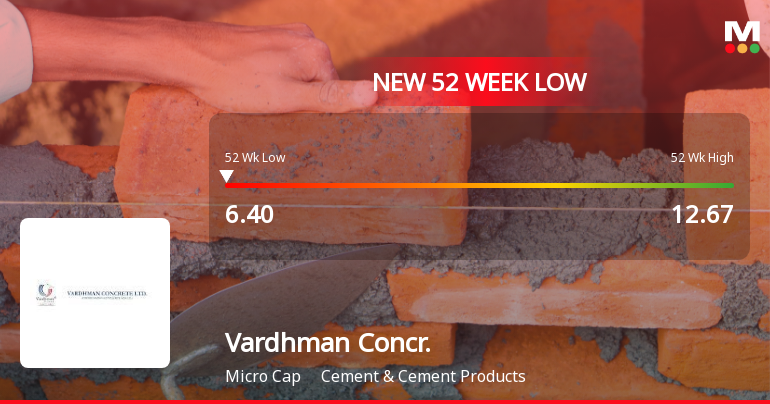
Vardhman Concrete Falls to 52-Week Low of Rs.6.4 Amid Prolonged Downtrend
Vardhman Concrete has reached a new 52-week low of Rs.6.4, marking a significant decline amid an extended period of price erosion. The stock has experienced a continuous downward trajectory over the past eleven trading sessions, reflecting a cumulative return of -26.1% during this period.
Read full news article Announcements
Shareholder Meeting / Postal Ballot-Scrutinizers Report
02-Dec-2025 | Source : BSEPursuant to Regulation 44 of the SEBI (Listing Obligations and Disclosure Requirements) Regulations 2015 please find enclosed herewith the voting results in the prescribed format in Annexure I for the 42nd Annual General Meeting of the Company held on Monday 01st December 2025 at the registered office of the Company along with the Report of the Scrutinizer. You are requested to kindly take the same on record.
Shareholder Meeting / Postal Ballot-Outcome of AGM
01-Dec-2025 | Source : BSEWe hereby submit the proceeding of 42nd Annual General Meeting of the Company was held on Monday 01st December 2025 at Registered Office of the Company.
Board Meeting Outcome for Outcome Ofboard Meeting Held On 14Th November 2025
14-Nov-2025 | Source : BSEWe wish to inform that the Board of Directors of the Company at its meeting held today i.e. 14th November 2025 has approved the Un-Audited Financial Results (Standalone) for the quarter ended 30th June 2025 & Quarter and half year ended 30th September 2025.
Corporate Actions

No Upcoming Board Meetings

No Dividend history available

No Splits history available

No Bonus history available

No Rights history available
Quality key factors
Valuation key factors
Technicals key factors
 Technical Indicator Scale: Bearish, Mildly Bearish, Sideways, Mildly Bullish, Bullish Turned
 Shareholding Snapshot : Mar 2025
Shareholding Compare (%holding)
Non Institution
7.0872
Held by 0 Schemes
Held by 0 FIIs
Vardhan Capital & Finance Ltd (16.61%)
Joy Homecreation Ltd (4.53%)
40.95%
Quarterly Results Snapshot (Standalone) - Sep'25 - QoQ
QoQ Growth in quarter ended Sep 2025 is 0.00% vs 0.00% in Jun 2025

QoQ Growth in quarter ended Sep 2025 is -100.00% vs -102.67% in Jun 2025
Half Yearly Results Snapshot (Standalone) - Sep'25
Growth in half year ended Sep 2025 is 0.00% vs 0.00% in Sep 2024
Growth in half year ended Sep 2025 is 70.00% vs -81.82% in Sep 2024
Nine Monthly Results Snapshot (Standalone) - Dec'24
YoY Growth in nine months ended Dec 2024 is 0.00% vs 0.00% in Dec 2023

YoY Growth in nine months ended Dec 2024 is -63.16% vs -58.33% in Dec 2023
Annual Results Snapshot (Standalone) - Mar'25
YoY Growth in year ended Mar 2025 is 0.00% vs 0.00% in Mar 2024
YoY Growth in year ended Mar 2025 is 63.57% vs -222.50% in Mar 2024
About Vardhman Concrete Ltd

Company Coordinates


