
Compare MPS with Similar Stocks
Stock DNA
Other Consumer Services
INR 3,107 Cr (Small Cap)
18.00
12
2.77%
-0.10
28.32%
5.18
Total Returns (Price + Dividend) 
Latest dividend: 49.29652597186104 per share ex-dividend date: Aug-13-2025
Risk Adjusted Returns v/s
Returns Beta

News

MPS Ltd. is Rated Sell by MarketsMOJO
MPS Ltd. is rated Sell by MarketsMOJO, with this rating last updated on 13 August 2025. However, the analysis and financial metrics presented here reflect the company’s current position as of 14 June 2026, providing investors with an up-to-date view of the stock’s fundamentals, returns, and technical outlook.
Read full news article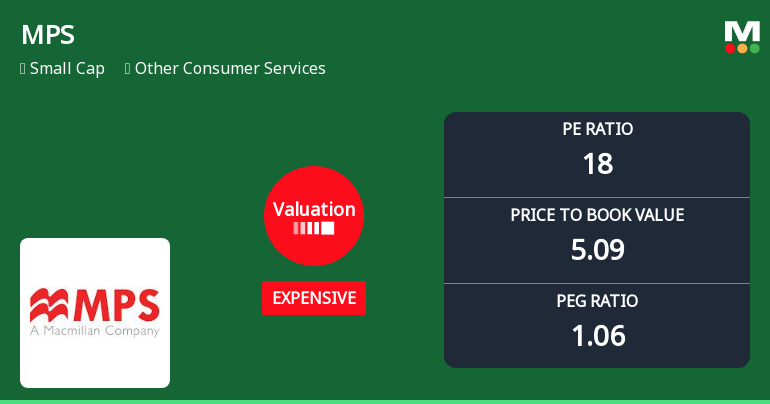
MPS Ltd. Valuation Shifts Signal Price Attractiveness Challenges Amid Sector Comparisons
MPS Ltd., a small-cap player in the Other Consumer Services sector, has experienced a notable shift in its valuation parameters, prompting a downgrade in its investment grade from Hold to Sell. The company’s price-to-earnings (P/E) and price-to-book value (P/BV) ratios have moved from very expensive to expensive territory, reflecting a diminished price attractiveness relative to historical and peer benchmarks. This article analyses the implications of these valuation changes and what they mean for investors navigating a challenging market environment.
Read full news article
MPS Ltd. is Rated Sell by MarketsMOJO
MPS Ltd. is rated Sell by MarketsMOJO, with this rating last updated on 13 Aug 2025. However, the analysis and financial metrics discussed here reflect the stock's current position as of 03 June 2026, providing investors with an up-to-date view of the company’s fundamentals, valuation, financial trends, and technical outlook.
Read full news article Announcements
Announcement under Regulation 30 (LODR)-Newspaper Publication
17-Jun-2026 | Source : BSENewspaper Publication with respect to Reminder regarding Special Window for Transfer & Dematerialisation of Physical Securities and Saksham Niveshak Campaign Notice.
Announcement under Regulation 30 (LODR)-Resignation of Company Secretary / Compliance Officer
29-May-2026 | Source : BSEResignation of Mr. Raman Sapra as Company Secretary Compliance Officer and Nodal Officer of the Company w.e.f. 28 August 2026.
Announcement under Regulation 30 (LODR)-Newspaper Publication
28-May-2026 | Source : BSESubmission of Newspaper Publication regarding transfer of Unpaid/Unclaimed Final Dividend for the Financial Year 2018-19 along with the underlying Equity Shares on the same to the IEPF.
Corporate Actions

No Upcoming Board Meetings

MPS Ltd. has declared 500% dividend, ex-date: 13 Aug 25

No Splits history available

No Bonus history available

No Rights history available
Quality key factors
Valuation key factors
Technicals key factors
 Technical Indicator Scale: Bearish, Mildly Bearish, Sideways, Mildly Bullish, Bullish Turned
 Shareholding Snapshot : Mar 2026
Shareholding Compare (%holding)
Promoters
None
Held by 2 Schemes (0.1%)
Held by 47 FIIs (1.47%)
Adi Bpo Services Limited (68.34%)
Mukul Mahavir Agrawal (4.46%)
22.35%
Quarterly Results Snapshot (Consolidated) - Mar'26 - YoY

YoY Growth in quarter ended Mar 2026 is 12.66% vs 21.88% in Mar 2025
YoY Growth in quarter ended Mar 2026 is -0.06% vs 63.95% in Mar 2025
Half Yearly Results Snapshot (Consolidated) - Sep'25
Growth in half year ended Sep 2025 is 6.22% vs 36.76% in Sep 2024

Growth in half year ended Sep 2025 is 48.34% vs 1.33% in Sep 2024
Nine Monthly Results Snapshot (Consolidated) - Dec'25
YoY Growth in nine months ended Dec 2025 is 3.38% vs 37.61% in Dec 2024
YoY Growth in nine months ended Dec 2025 is 23.90% vs 13.08% in Dec 2024
Annual Results Snapshot (Consolidated) - Mar'26
YoY Growth in year ended Mar 2026 is 5.71% vs 33.30% in Mar 2025
YoY Growth in year ended Mar 2026 is 16.33% vs 25.38% in Mar 2025
About MPS Ltd.

Company Coordinates


