
Compare Inani Securities with Similar Stocks
Stock DNA
Non Banking Financial Company (NBFC)
INR 11 Cr (Micro Cap)
24.00
21
0.00%
0.00
2.13%
0.54
Total Returns (Price + Dividend) 
Latest dividend: 1.0000 per share ex-dividend date: Sep-24-2008
Risk Adjusted Returns v/s
Returns Beta

News
When is the next results date for Inani Securities Ltd?
The next results date for Inani Securities Ltd is scheduled for 29 May 2026....
Read full news article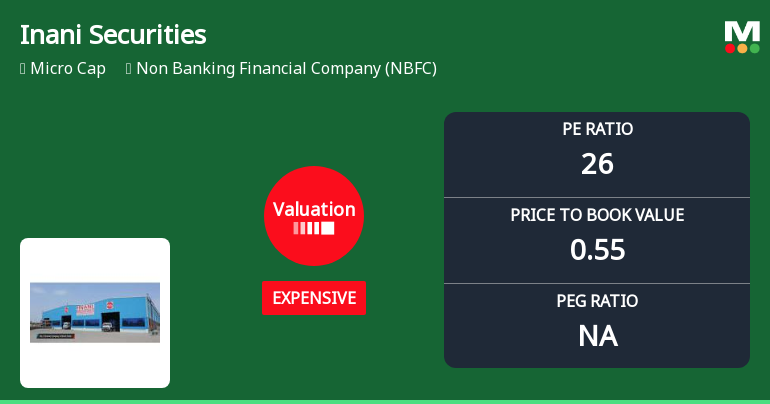
Inani Securities Ltd Valuation Shifts Signal Price Attractiveness Change Amid NBFC Sector Dynamics
Inani Securities Ltd, a micro-cap player in the Non Banking Financial Company (NBFC) sector, has experienced a notable shift in its valuation parameters, moving from a very expensive to an expensive rating. This change reflects evolving market perceptions and has implications for investors assessing the stock’s price attractiveness relative to its historical and peer benchmarks.
Read full news article Announcements
Board Meeting Intimation for Rescheduling Of The Board Meeting Due To The Declared Exchange Holiday On 28.05.2026 On Account Of Holiday E.G. Eid Board Meeting On Next Day 29.05.2026
26-May-2026 | Source : BSEInani Securities Ltdhas informed BSE that the meeting of the Board of Directors of the Company is scheduled on 29/05/2026 inter alia to consider and approve Rescheduling of the Board Meeting due to the declared Exchange Holiday on 28.05.2026 on account of Holiday e.g. Eid Board Meeting on next day 29.05.2026
Board Meeting Intimation for Board Meeting Intimation For Audited Financials Results For The Quarter And Financial Year Ended 31St March 2026
12-May-2026 | Source : BSEInani Securities Ltdhas informed BSE that the meeting of the Board of Directors of the Company is scheduled on 28/05/2026 inter alia to consider and approve Board Meeting Intimation for Audited Financials Results For The Quarter And Financial Year Ended 31st March 2026
Announcement under Regulation 30 (LODR)-Change in RTA
27-Apr-2026 | Source : BSEIntimation of change of address details of Registrar and RTA
Corporate Actions

29 May 2026

Inani Securities Ltd has declared 10% dividend, ex-date: 24 Sep 08

No Splits history available

No Bonus history available

No Rights history available
Quality key factors
Valuation key factors
Technicals key factors
 Technical Indicator Scale: Bearish, Mildly Bearish, Sideways, Mildly Bullish, Bullish Turned
 Shareholding Snapshot : Mar 2026
Shareholding Compare (%holding)
Promoters
None
Held by 0 Schemes
Held by 0 FIIs
Ramakanth Inani (14.62%)
Sangeeta (2.39%)
26.49%
Quarterly Results Snapshot (Standalone) - Dec'25 - YoY

YoY Growth in quarter ended Dec 2025 is -10.00% vs 0.00% in Dec 2024
YoY Growth in quarter ended Dec 2025 is -66.67% vs 100.00% in Dec 2024
Half Yearly Results Snapshot (Standalone) - Sep'25
Growth in half year ended Sep 2025 is -38.55% vs 88.64% in Sep 2024
Growth in half year ended Sep 2025 is -76.19% vs 600.00% in Sep 2024
Nine Monthly Results Snapshot (Standalone) - Dec'25
YoY Growth in nine months ended Dec 2025 is -30.97% vs 52.70% in Dec 2024
YoY Growth in nine months ended Dec 2025 is -74.07% vs 350.00% in Dec 2024
Annual Results Snapshot (Standalone) - Mar'25
YoY Growth in year ended Mar 2025 is 17.74% vs 18.10% in Mar 2024
YoY Growth in year ended Mar 2025 is -56.82% vs 193.33% in Mar 2024
About Inani Securities Ltd

Company Coordinates


