
Compare Sterling Powerg. with Similar Stocks
Dashboard
Weak Long Term Fundamental Strength with an average Return on Capital Employed (ROCE) of 4.86%
- Poor long term growth as Operating profit has grown by an annual rate 18.84% of over the last 5 years
- Low ability to service debt as the company has a high Debt to EBITDA ratio of 2.25 times
With a growth in Net Sales of 232.55%, the company declared Very Positive results in Mar 26
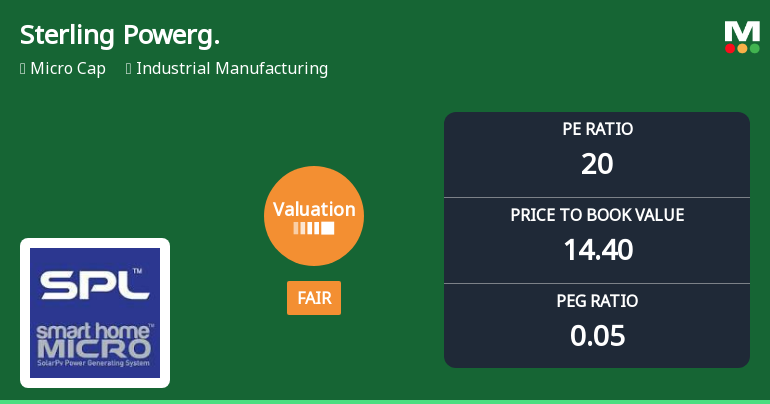
With ROCE of 24.3, it has a Fair valuation with a 6.1 Enterprise value to Capital Employed
Reducing Promoter Confidence
Stock DNA
Industrial Manufacturing
INR 19 Cr (Micro Cap)
20.00
35
0.00%
1.62
71.01%
14.40
Total Returns (Price + Dividend) 
Sterling Powerg. for the last several years.
Risk Adjusted Returns v/s
Returns Beta

News
Sterling Powergensys Ltd Valuation Shifts Signal Fair Price Amid Strong Returns
Sterling Powergensys Ltd, a micro-cap player in the industrial manufacturing sector, has witnessed a notable shift in its valuation parameters, moving from an attractive to a fair rating. This change comes amid a strong rally in the stock price and improved financial metrics, prompting a reassessment of its price-to-earnings and price-to-book value multiples relative to historical averages and peer comparisons.
Read full news article
Sterling Powergensys Ltd Valuation Shifts Signal Renewed Price Attractiveness
Sterling Powergensys Ltd has witnessed a notable shift in its valuation parameters, moving from a fair to an attractive rating, driven by improved price-to-earnings and price-to-book value ratios. This re-rating comes amid strong operational metrics and a robust return profile, positioning the micro-cap industrial manufacturing firm as a compelling consideration for investors seeking value in a challenging sector.
Read full news article
Sterling Powergensys Ltd Upgraded to Hold on Technical and Financial Improvements
Sterling Powergensys Ltd, a micro-cap player in the industrial manufacturing sector, has seen its investment rating upgraded from Sell to Hold as of 6 July 2026. This change reflects a nuanced improvement across technical indicators, valuation metrics, and financial trends, signalling a cautious but positive outlook for investors amid mixed long-term fundamentals.
Read full news article Announcements
Compliances-Certificate under Reg. 74 (5) of SEBI (DP) Regulations 2018
14-Jul-2026 | Source : BSEAs per attachment.
Resubmission Of Audited Financial Results Auditors Report And Declaration Under Regulation 33 Of SEBI (LODR) Regulations 2015 For The Financial Year Ended 31St March 2026.
02-Jul-2026 | Source : BSEAs per Attachment.
Closure of Trading Window
26-Jun-2026 | Source : BSEAs Per Attachment
Corporate Actions

No Upcoming Board Meetings

No Dividend history available

No Splits history available

No Bonus history available

No Rights history available
Quality key factors
Valuation key factors
Technicals key factors
 Technical Indicator Scale: Bearish, Mildly Bearish, Sideways, Mildly Bullish, Bullish Turned
 Shareholding Snapshot : Mar 2026
Shareholding Compare (%holding)
Non Institution
None
Held by 0 Schemes
Held by 0 FIIs
S Venkata Subramanian (8.82%)
None
49.76%
Quarterly Results Snapshot (Standalone) - Mar'26 - QoQ

QoQ Growth in quarter ended Mar 2026 is 232.55% vs 518.07% in Dec 2025

QoQ Growth in quarter ended Mar 2026 is 1,257.14% vs 56.25% in Dec 2025
Half Yearly Results Snapshot (Standalone) - Sep'25
Growth in half year ended Sep 2025 is -85.29% vs 2,958.33% in Sep 2024
Growth in half year ended Sep 2025 is -1,400.00% vs 113.64% in Sep 2024
Nine Monthly Results Snapshot (Standalone) - Dec'25
YoY Growth in nine months ended Dec 2025 is -42.85% vs 2,412.77% in Dec 2024
YoY Growth in nine months ended Dec 2025 is -783.33% vs -103.82% in Dec 2024
Annual Results Snapshot (Standalone) - Mar'26
YoY Growth in year ended Mar 2026 is 88.89% vs 83.14% in Mar 2025
YoY Growth in year ended Mar 2026 is 421.05% vs -93.31% in Mar 2025
About Sterling Powergensys Ltd

Company Coordinates


