
Compare Schneider Elect. with Similar Stocks
Dashboard
High Management Efficiency with a high ROCE of 30.28%
High Debt Company with a Debt to Equity ratio (avg) of 3.72 times
Healthy long term growth as Operating profit has grown by an annual rate 52.02%
With ROCE of 35.1, it has a Very Expensive valuation with a 36.1 Enterprise value to Capital Employed
Increasing Participation by Institutional Investors
Stock DNA
Heavy Electrical Equipment
INR 33,655 Cr (Small Cap)
154.00
47
0.00%
0.25
28.97%
44.71
Total Returns (Price + Dividend) 
Latest dividend: 0.4000000000000001 per share ex-dividend date: Jul-19-2012
Risk Adjusted Returns v/s
Returns Beta

News
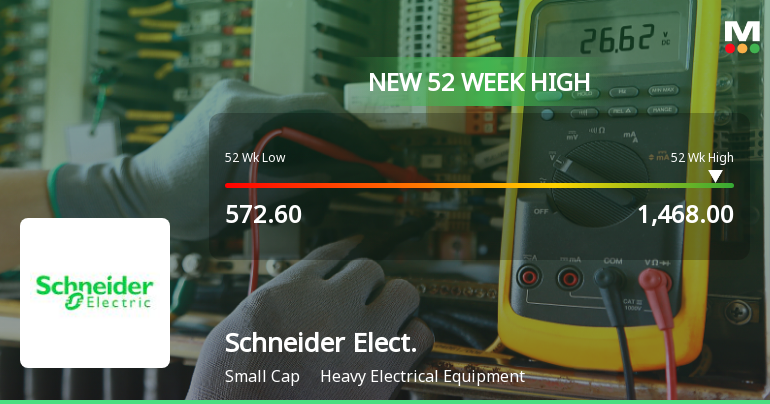
Broad-Based Technical Strength Lifts Schneider Electric Infrastructure Ltd to 52-Week High of Rs 1468
With a remarkable 86.12% gain over the past year, Schneider Electric Infrastructure Ltd surged to a fresh 52-week high of Rs 1468 on 24 Jun 2026, significantly outperforming the Sensex which declined 6.76% over the same period. This milestone reflects a sustained rally fuelled by robust technical momentum across multiple timeframes.
Read full news article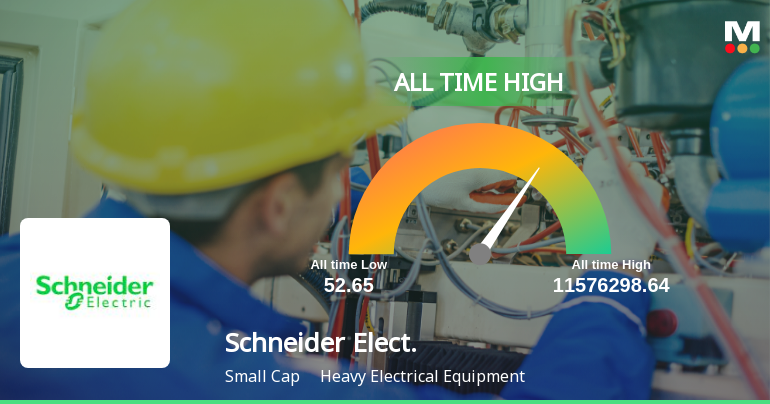
Schneider Electric Infrastructure Ltd Hits All-Time High of Rs 1,468 as Momentum Builds Across Timeframes
Extending its winning streak to six consecutive sessions, Schneider Electric Infrastructure Ltd touched a fresh all-time high of Rs 1,468 on 24 Jun 2026, marking a remarkable 22.77% gain over this period. This surge has outpaced the broader Sensex, which declined by 0.34% on the same day, underscoring the stock’s strong relative performance within the heavy electrical equipment sector.
Read full news article
Broad-Based Technical Strength Lifts Schneider Electric Infrastructure Ltd to 52-Week High of Rs 1440.05
With a decisive surge to Rs 1440.05 on 23 Jun 2026, Schneider Electric Infrastructure Ltd has reached a fresh 52-week high, marking a remarkable 86.46% gain over the past year. This rally is underpinned by a confluence of strong technical indicators and sustained price momentum, setting the stock apart in the Heavy Electrical Equipment sector.
Read full news article Announcements
Rumour verification - Regulation 30(11)
16-Jun-2026 | Source : BSEClarification confirmation on news item appearing in Money control. In this regard please note that the news does not pertain to Schneider Electric Infrastructure Limited. Please find enclosed the clarification letter.
Announcement under Regulation 30 (LODR)-Resignation of Director
16-Jun-2026 | Source : BSEIntimation regarding resignation of Mr. Chinmoy Das as Whole Time Director of the Company effective from close of business hours of June 30 2026 is enclosed herewith as per Regulation 30. Please take the same in records.
Announcement under Regulation 30 (LODR)-Change in Directorate
16-Jun-2026 | Source : BSEIntimation regarding resignation of Mr. Chinmoy Das as WTD and SMP of the Company effective from close of business hours of June 30 2026 is enclosed herewith.
Corporate Actions

No Upcoming Board Meetings

Schneider Electric Infrastructure Ltd has declared 20% dividend, ex-date: 19 Jul 12

No Splits history available

No Bonus history available

No Rights history available
Quality key factors
Valuation key factors
Technicals key factors
 Technical Indicator Scale: Bearish, Mildly Bearish, Sideways, Mildly Bullish, Bullish Turned
 Shareholding Snapshot : Mar 2026
Shareholding Compare (%holding)
Promoters
None
Held by 22 Schemes (3.28%)
Held by 113 FIIs (3.19%)
Energy Grid Automation Transformers And Switchgears India Private Limited (70.57%)
Akash Bhanshali (1.97%)
14.35%
Quarterly Results Snapshot (Standalone) - Mar'26 - YoY

YoY Growth in quarter ended Mar 2026 is 0.48% vs 24.41% in Mar 2025
YoY Growth in quarter ended Mar 2026 is -59.77% vs 1,564.94% in Mar 2025
Half Yearly Results Snapshot (Standalone) - Sep'25
Growth in half year ended Sep 2025 is 6.64% vs 20.34% in Sep 2024
Growth in half year ended Sep 2025 is -8.94% vs 32.10% in Sep 2024
Nine Monthly Results Snapshot (Standalone) - Dec'25
YoY Growth in nine months ended Dec 2025 is 12.25% vs 18.15% in Dec 2024
YoY Growth in nine months ended Dec 2025 is -10.64% vs 26.39% in Dec 2024
Annual Results Snapshot (Standalone) - Mar'26
YoY Growth in year ended Mar 2026 is 9.63% vs 19.49% in Mar 2025
YoY Growth in year ended Mar 2026 is -20.65% vs 55.72% in Mar 2025
About Schneider Electric Infrastructure Ltd

Company Coordinates


