
Compare Capital Trade Lk with Similar Stocks
Dashboard
With a Operating Losses, the company has a Weak Long Term Fundamental Strength
- Poor long term growth as Operating profit has grown by an annual rate of -10.06%
Negative results in Mar 26
With ROE of 2.6, it has a Very Expensive valuation with a 2.8 Price to Book Value
Below par performance in long term as well as near term
Stock DNA
Non Banking Financial Company (NBFC)
INR 196 Cr (Micro Cap)
497.00
21
0.00%
1.78
2.56%
2.78
Total Returns (Price + Dividend) 
Latest dividend: 0.05 per share ex-dividend date: Sep-24-2018
Risk Adjusted Returns v/s
Returns Beta

News
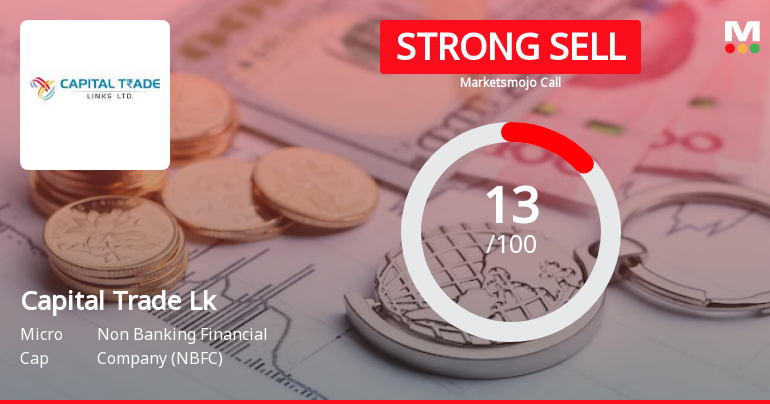
Capital Trade Links Ltd is Rated Strong Sell
Capital Trade Links Ltd is rated Strong Sell by MarketsMOJO, with this rating last updated on 14 January 2026. However, the analysis and financial metrics discussed here reflect the stock's current position as of 23 June 2026, providing investors with an up-to-date view of the company’s fundamentals, valuation, financial trends, and technical outlook.
Read full news article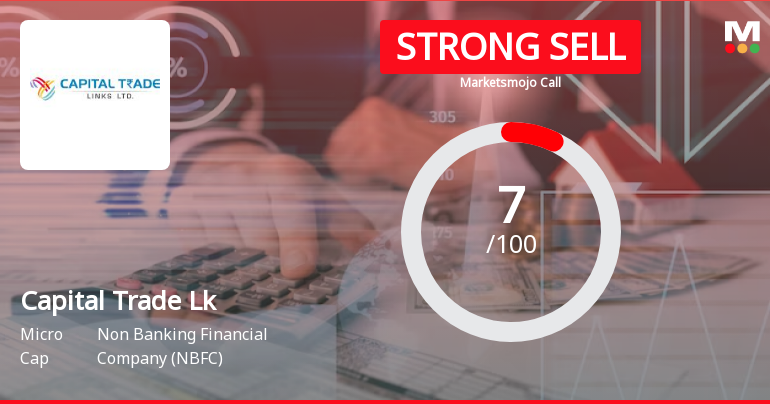
Capital Trade Links Ltd is Rated Strong Sell
Capital Trade Links Ltd is rated Strong Sell by MarketsMOJO, with this rating last updated on 14 January 2026. However, the analysis and financial metrics presented here reflect the stock's current position as of 12 June 2026, providing investors with an up-to-date view of the company’s performance and outlook.
Read full news article
Capital Trade Links Ltd is Rated Strong Sell
Capital Trade Links Ltd is rated Strong Sell by MarketsMOJO, with this rating last updated on 14 Jan 2026. However, the analysis and financial metrics discussed here reflect the stock's current position as of 29 May 2026, providing investors with an up-to-date view of its fundamentals, valuation, financial trends, and technical outlook.
Read full news article Announcements
Disclosure As Per Regulation 7(2) Of SEBI(Prohibition Of Insider Trading) Regulations 2015.
27-May-2026 | Source : BSEDisclosure as per Regulation 7(2) of SEBI(Prohibition of Insider Trading) Regulations 2015
Compliances-Reg.24(A)-Annual Secretarial Compliance
27-May-2026 | Source : BSEAnnual Secretarial Compliance Report for the Financial Year 2025-26.
Financial Results For The Quarter And Year Ended On March 31 2026.
23-May-2026 | Source : BSEFinancial Results for the Quarter and Year ended on March 31 2026.
Corporate Actions

No Upcoming Board Meetings

Capital Trade Links Ltd has declared 10% dividend, ex-date: 24 Sep 18

No Splits history available

Capital Trade Links Ltd has announced 1:1 bonus issue, ex-date: 02 Apr 25

No Rights history available
Quality key factors
Valuation key factors
Technicals key factors
 Technical Indicator Scale: Bearish, Mildly Bearish, Sideways, Mildly Bullish, Bullish Turned
 Shareholding Snapshot : Mar 2026
Shareholding Compare (%holding)
Non Institution
None
Held by 0 Schemes
Held by 0 FIIs
Krishan Kumar & Sons Huf (25.94%)
Dhanadeepa Consultant Private Limited (5.96%)
17.66%
Quarterly Results Snapshot (Standalone) - Mar'26 - QoQ

QoQ Growth in quarter ended Mar 2026 is -22.61% vs 5.99% in Dec 2025
QoQ Growth in quarter ended Mar 2026 is -400.98% vs -55.46% in Dec 2025
Half Yearly Results Snapshot (Standalone) - Sep'25

Growth in half year ended Sep 2025 is -3.41% vs -24.91% in Sep 2024
Growth in half year ended Sep 2025 is 54.37% vs 15.73% in Sep 2024
Nine Monthly Results Snapshot (Standalone) - Dec'25
YoY Growth in nine months ended Dec 2025 is -6.39% vs -33.84% in Dec 2024
YoY Growth in nine months ended Dec 2025 is 9.04% vs -35.87% in Dec 2024
Annual Results Snapshot (Standalone) - Mar'26
YoY Growth in year ended Mar 2026 is -14.05% vs -29.11% in Mar 2025
YoY Growth in year ended Mar 2026 is -17.26% vs -76.38% in Mar 2025
About Capital Trade Links Ltd

Company Coordinates


