
Compare Maris Spinners with Similar Stocks
Dashboard
High Debt company with Weak Long Term Fundamental Strength
- Poor long term growth as Operating profit has grown by an annual rate -166.88% of over the last 5 years
- High Debt Company with a Debt to Equity ratio (avg) of 2.49 times
Flat results in Dec 25
Risky - Negative Operating Profits
Consistent Underperformance against the benchmark over the last 3 years
Stock DNA
Garments & Apparels
INR 24 Cr (Micro Cap)
NA (Loss Making)
22
0.00%
3.71
-2.60%
1.28
Total Returns (Price + Dividend) 
Latest dividend: 1 per share ex-dividend date: Sep-13-2022
Risk Adjusted Returns v/s
Returns Beta

News

Maris Spinners Ltd is Rated Strong Sell
Maris Spinners Ltd is rated Strong Sell by MarketsMOJO, with this rating last updated on 11 Nov 2025. However, the analysis and financial metrics discussed here reflect the stock's current position as of 15 May 2026, providing investors with an up-to-date view of the company’s fundamentals, valuation, financial trend, and technical outlook.
Read full news article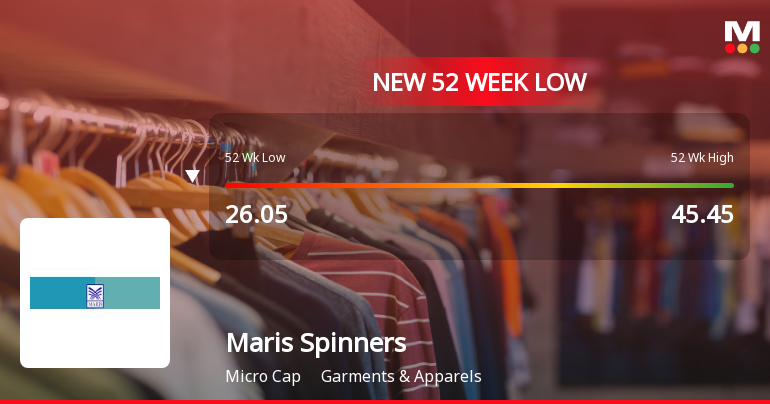
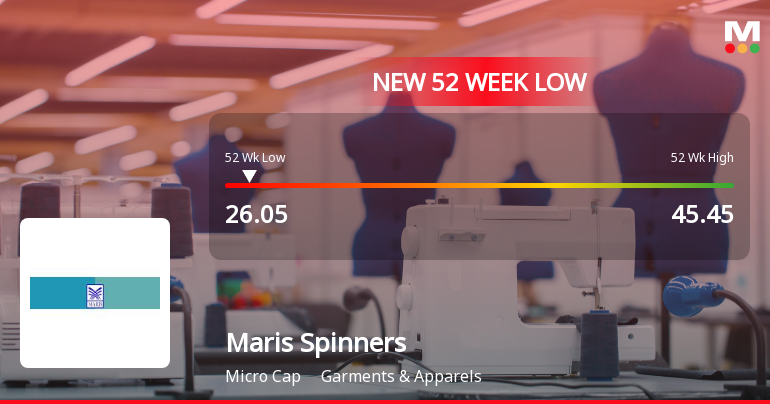
Maris Spinners Ltd Falls to 52-Week Low of Rs 24 as Sell-Off Deepens
For the second consecutive session, Maris Spinners Ltd has succumbed to selling pressure, hitting a fresh 52-week low of Rs 24 on 24 Mar 2026. This decline comes despite a textile sector gain of 2.6% and a Sensex rally of nearly 2%, underscoring the stock's persistent underperformance.
Read full news article Announcements
Board Meeting Intimation for To Consider And Approve Audited Financial Results And Reappointment Of Managing Director For A Period Of 3 Years From 23-09-2026 To 22-09-2029 And Fixing The Date Of Annual General Meeting
02-May-2026 | Source : BSEMaris Spinners Ltd-has informed BSE that the meeting of the Board of Directors of the Company is scheduled on 28/05/2026 inter alia to consider and approve Board meeting on 28-05-2026 with the following agenda 1. to approve audited financial results 2. to approve the date of the 47th Annual General meeting 3. To fix the record date / Book closure date 4. To approve the Notice of Annual General Meeting 5. To approve the related party transactions for the half year ended 31st March 2026 6. To reappoint Mr. T Raghuraman Managing Director for a period of 3 years from 23-09-2026 to 22-09-2029 7. Any other subject with the approval of the Chairman
Disclosure Received From The Promoter Under Regulation 7(2) Of SEBI Prohibition Of Insider Trading Regulations 2015 Regarding Disposal And Acquisition Of Shares
10-Apr-2026 | Source : BSECompany received disclosure from a promoter under Reg 7 (2) of SEBI Prohibition of Insider trading Regulations 2015 that he transferred his shares from his HUF category to self individual category and continues to be promoter .
Compliance For Mar 26 Qtr
08-Apr-2026 | Source : BSEPCS certificate for March 26 qtr
Corporate Actions

28 May 2026

Maris Spinners Ltd has declared 10% dividend, ex-date: 13 Sep 22

No Splits history available

No Bonus history available

No Rights history available
Quality key factors
Valuation key factors
Technicals key factors
 Technical Indicator Scale: Bearish, Mildly Bearish, Sideways, Mildly Bullish, Bullish Turned
 Shareholding Snapshot : Mar 2026
Shareholding Compare (%holding)
Promoters
None
Held by 0 Schemes
Held by 0 FIIs
Harigovind Ananthakumar (20.72%)
Rajesh Nathmal Kabra (2.04%)
23.24%
Quarterly Results Snapshot (Standalone) - Dec'25 - QoQ

QoQ Growth in quarter ended Dec 2025 is -4.36% vs 13.18% in Sep 2025
QoQ Growth in quarter ended Dec 2025 is -59.62% vs -15.56% in Sep 2025
Half Yearly Results Snapshot (Standalone) - Sep'25

Growth in half year ended Sep 2025 is -0.68% vs -2.69% in Sep 2024
Growth in half year ended Sep 2025 is 44.32% vs 71.10% in Sep 2024
Nine Monthly Results Snapshot (Standalone) - Dec'25
YoY Growth in nine months ended Dec 2025 is -1.31% vs 0.96% in Dec 2024
YoY Growth in nine months ended Dec 2025 is 29.57% vs 71.25% in Dec 2024
Annual Results Snapshot (Standalone) - Mar'25
YoY Growth in year ended Mar 2025 is 5.20% vs 9.43% in Mar 2024
YoY Growth in year ended Mar 2025 is 86.20% vs 15.93% in Mar 2024
About Maris Spinners Ltd

Company Coordinates


