
Compare BITS with Similar Stocks
Dashboard
Weak Long Term Fundamental Strength with an average Return on Equity (ROE) of 3.73%
- Poor long term growth as Operating profit has grown by an annual rate 13.16% of over the last 5 years
- Company's ability to service its debt is weak with a poor EBIT to Interest (avg) ratio of 0.10
Flat results in Jun 26
With ROE of 3.4, it has a Very Expensive valuation with a 4 Price to Book Value
Below par performance in long term as well as near term
Stock DNA
Software Products
INR 84 Cr (Micro Cap)
103.00
21
0.00%
-0.04
3.44%
3.95
Total Returns (Price + Dividend) 
BITS for the last several years.
Risk Adjusted Returns v/s
Returns Beta

News
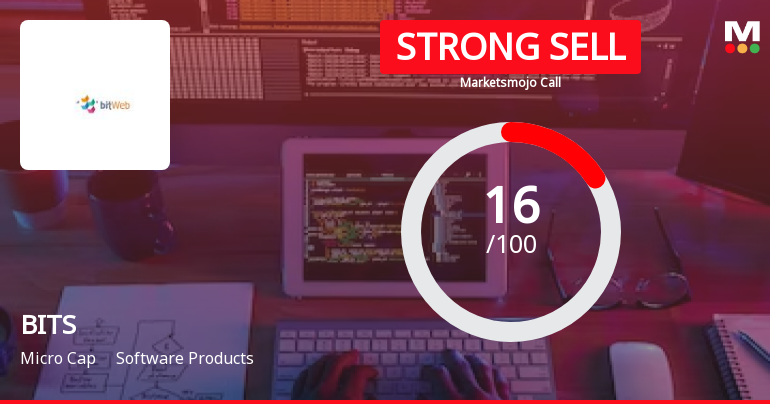
BITS Ltd is Rated Strong Sell
BITS Ltd is rated Strong Sell by MarketsMOJO. This rating was last updated on 02 January 2026, reflecting a shift from the previous 'Sell' grade. However, the analysis and financial metrics discussed below represent the stock’s current position as of 01 August 2026, providing investors with an up-to-date perspective on the company’s performance and outlook.
Read full news articleAre BITS Ltd latest results good or bad?
BITS Ltd. has reported its financial results for Q1 FY27, revealing a mixed operational performance. The company recorded consolidated net sales of ₹0.44 crores, reflecting a modest quarter-on-quarter growth of 2.33% from ₹0.43 crores in the previous quarter, and a significant year-on-year increase of 41.94% from ₹0.31 crores in Q1 FY26. This demonstrates the company's ability to expand its revenue base despite its small scale. However, the consolidated net profit for the same quarter was ₹0.18 crores, which represents a sequential decline of 25.00% from ₹0.24 crores in Q4 FY26, indicating potential challenges in operational efficiency or unexpected cost pressures. On a year-on-year basis, net profit doubled from ₹0.09 crores in Q1 FY26, suggesting that the company has managed to leverage revenue growth into improved profitability over a longer timeframe. Operating margins, excluding other income, compres...
Read full news article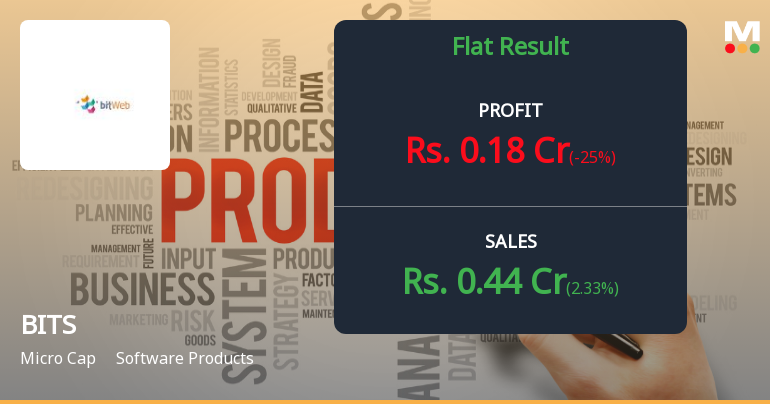
BITS Ltd Q1 FY27: Micro-Cap Software Firm Faces Steep Valuation Concerns Despite Revenue Growth
BITS Ltd., a micro-cap software products company with a market capitalisation of ₹83.00 crores, reported a consolidated net profit of ₹0.18 crores for Q1 FY27, representing a sharp 25.00% decline on a quarter-on-quarter basis, though the year-on-year comparison shows a robust 100.00% surge. The stock, trading at ₹7.49 as of July 24, 2026, has declined 1.06% in the latest session and continues to face significant headwinds, down 30.13% over the past year whilst substantially underperforming the broader market.
Read full news article Announcements
Announcement under Regulation 30 (LODR)-Newspaper Publication
27-Jul-2026 | Source : BSEPursuant to Regulation 47 of the SEBI(Listing Obligations & Disclosure Requirements) Regulations 2015 please find enclosed herewith scanned copy of Newspaper release of the Un-audited Standalone & Consolidated Financial Results for the Quarter Ended 30.06.2026.
Board Meeting Outcome for OUTCOME OF THE BOARD MEETING HELD ON 24TH JULY 2026
24-Jul-2026 | Source : BSEThe Board of Directors at its meeting held today i.e. 24th July 2026 have considered and approved the Un-Audited Standalone & Consolidated Financial Results for the Quarter and Three Months Ended 30th June 2026;
Un-Audited Financial Results For The Quarter Ended 30.06.2026.
24-Jul-2026 | Source : BSEThe Board of the Directors at its meeting held on 24th July 2026 have considered and approved the Unaudited Standalone & Consolidated Financial Results for the Quarter Ended 30.06.2026.
Corporate Actions

No Upcoming Board Meetings

No Dividend history available

No Splits history available

No Bonus history available

No Rights history available
Quality key factors
Valuation key factors
Technicals key factors
 Technical Indicator Scale: Bearish, Mildly Bearish, Sideways, Mildly Bullish, Bullish Turned
 Shareholding Snapshot : Jun 2026
Shareholding Compare (%holding)
Promoters
None
Held by 4 Schemes (0.03%)
Held by 0 FIIs
Vizwise Commerce Private Limited (65.07%)
None
33.24%
Quarterly Results Snapshot (Consolidated) - Jun'26 - QoQ

QoQ Growth in quarter ended Jun 2026 is 2.33% vs 10.26% in Mar 2026
QoQ Growth in quarter ended Jun 2026 is -25.00% vs -14.29% in Mar 2026
Half Yearly Results Snapshot (Consolidated) - Sep'25

Growth in half year ended Sep 2025 is 25.00% vs 23.81% in Sep 2024
Growth in half year ended Sep 2025 is 300.00% vs 25.00% in Sep 2024
Nine Monthly Results Snapshot (Consolidated) - Dec'25
YoY Growth in nine months ended Dec 2025 is 25.30% vs 27.69% in Dec 2024
YoY Growth in nine months ended Dec 2025 is 220.00% vs -93.67% in Dec 2024
Annual Results Snapshot (Consolidated) - Mar'26
YoY Growth in year ended Mar 2026 is 30.09% vs 26.97% in Mar 2025
YoY Growth in year ended Mar 2026 is 213.04% vs -90.46% in Mar 2025
About BITS Ltd

Company Coordinates


