
Compare Sanco Trans with Similar Stocks
Dashboard
Company has a Debt to Equity ratio (avg) of 0.09 times
Poor long term growth as Net Sales has grown by an annual rate of 6.44% and Operating profit at 2.11% over the last 5 years
With a growth in Net Profit of 126.85%, the company declared Very Positive results in Mar 26
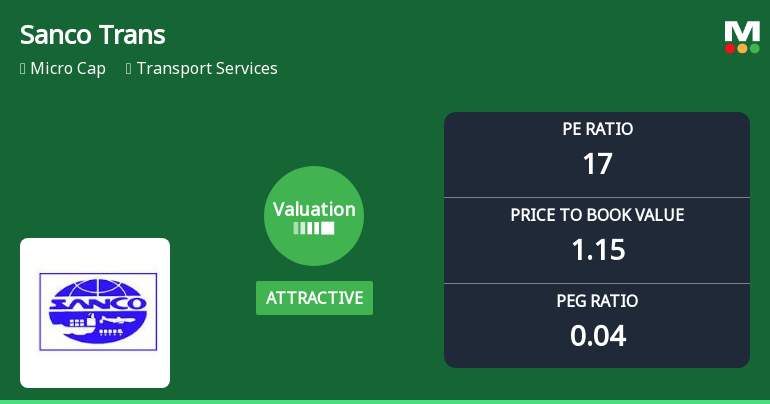
With ROE of 6.8, it has a Attractive valuation with a 1.1 Price to Book Value
Majority shareholders : Promoters
Consistent Underperformance against the benchmark over the last 3 years
Stock DNA
Transport Services
INR 129 Cr (Micro Cap)
17.00
35
0.38%
0.03
6.83%
1.15
Total Returns (Price + Dividend) 
Latest dividend: 2.7 per share ex-dividend date: Jul-24-2025
Risk Adjusted Returns v/s
Returns Beta

News
Sanco Trans Ltd. Valuation Shifts Signal Renewed Price Attractiveness
Sanco Trans Ltd., a micro-cap player in the transport services sector, has witnessed a notable shift in its valuation parameters, moving from an expensive to an attractive rating. This change accompanies a modest market performance and a recent upgrade in its Mojo Grade from Strong Sell to Hold, signalling a cautious but improved outlook for investors.
Read full news article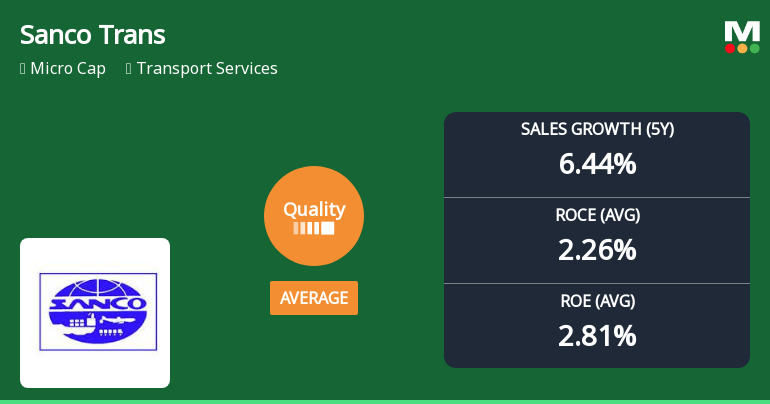
Sanco Trans Ltd. Quality Grade Upgrade Signals Improving Fundamentals
Sanco Trans Ltd., a micro-cap player in the transport services sector, has witnessed a notable upgrade in its quality grade from below average to average as of 13 May 2026. This shift reflects a gradual improvement in key business fundamentals including return ratios, debt management, and operational consistency, positioning the company on a more stable footing amid a challenging industry backdrop.
Read full news article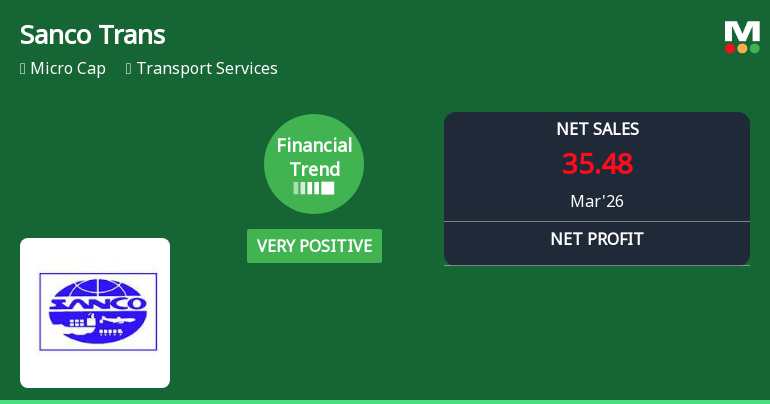
Sanco Trans Ltd. Reports Very Positive Quarterly Financial Performance Amid Mixed Market Returns
Sanco Trans Ltd., a micro-cap player in the Transport Services sector, has demonstrated a marked improvement in its financial performance for the quarter ending March 2026. Despite a recent downgrade in its Mojo Grade to 'Sell', the company’s latest quarterly results reveal robust revenue growth and margin expansion, signalling a potential turnaround in operational efficiency and profitability.
Read full news article Announcements
Board Meeting Outcome for Dividend Recommendation
28-May-2026 | Source : BSELetter attached - dividend recommendation
Financial Results For The Quarter And Year Ended March 31 2026
28-May-2026 | Source : BSEFinancial Results for the quarter and year ended March 31 2026
Material Information As Per Regulation 30 Of SEBI LODR Regulations 2015
28-May-2026 | Source : BSEDisclosure of material information as per Regulation 30 of SEBI LODR Regulations 2015 - AGM Date
Corporate Actions

No Upcoming Board Meetings

Sanco Trans Ltd. has declared 27% dividend, ex-date: 24 Jul 25

No Splits history available

No Bonus history available

No Rights history available
Quality key factors
Valuation key factors
Technicals key factors
 Technical Indicator Scale: Bearish, Mildly Bearish, Sideways, Mildly Bullish, Bullish Turned
 Shareholding Snapshot : Mar 2026
Shareholding Compare (%holding)
Promoters
None
Held by 0 Schemes
Held by 0 FIIs
Sudharsan Logistics Private Limited (27.72%)
Venkattu Srinivasan (6.04%)
25.05%
Quarterly Results Snapshot (Standalone) - Mar'26 - QoQ

QoQ Growth in quarter ended Mar 2026 is -6.61% vs 18.98% in Dec 2025

QoQ Growth in quarter ended Mar 2026 is 126.85% vs -77.96% in Dec 2025
Half Yearly Results Snapshot (Standalone) - Sep'25
Growth in half year ended Sep 2025 is 35.11% vs 0.81% in Sep 2024
Growth in half year ended Sep 2025 is 1,092.73% vs 57.14% in Sep 2024
Nine Monthly Results Snapshot (Standalone) - Dec'25
YoY Growth in nine months ended Dec 2025 is 35.02% vs 6.60% in Dec 2024
YoY Growth in nine months ended Dec 2025 is 641.75% vs 106.00% in Dec 2024
Annual Results Snapshot (Standalone) - Mar'26
YoY Growth in year ended Mar 2026 is 32.46% vs 7.19% in Mar 2025
YoY Growth in year ended Mar 2026 is 576.51% vs 29.57% in Mar 2025
About Sanco Trans Ltd.

Company Coordinates


