
Compare Suprajit Engg. with Similar Stocks
Stock DNA
Auto Components & Equipments
INR 7,022 Cr (Small Cap)
37.00
38
0.64%
0.45
12.88%
4.82
Total Returns (Price + Dividend) 
Latest dividend: 1.5 per share ex-dividend date: Feb-13-2026
Risk Adjusted Returns v/s
Returns Beta

News
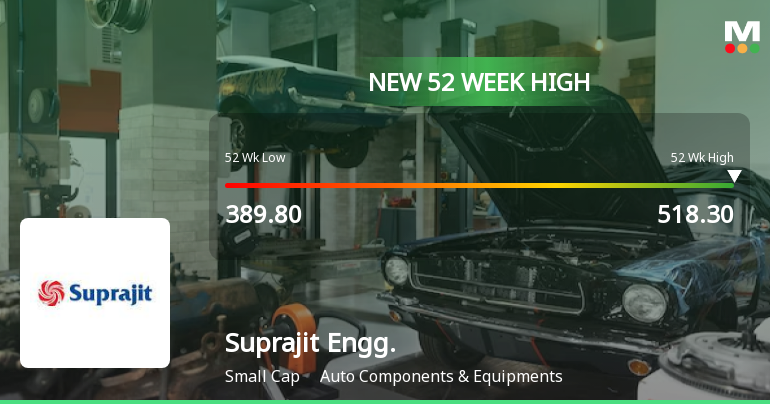
Broad-Based Technical Strength Lifts Suprajit Engineering Ltd to 52-Week High of Rs 521.75
Surging past its previous highs, Suprajit Engineering Ltd touched a fresh 52-week peak of Rs 521.75 on 3 Aug 2026, propelled by a confluence of bullish technical indicators and sustained price momentum.
Read full news article
Suprajit Engineering Ltd is Rated Buy
Suprajit Engineering Ltd is rated Buy by MarketsMOJO, with this rating last updated on 01 June 2026. However, the analysis and financial metrics discussed here reflect the company’s current position as of 27 July 2026, providing investors with the most recent insights into its performance and outlook.
Read full news article
Suprajit Engineering Ltd is Rated Buy
Suprajit Engineering Ltd is rated Buy by MarketsMOJO, with this rating last updated on 01 June 2026. However, all fundamentals, returns, and financial metrics discussed here reflect the company’s current position as of 16 July 2026, providing investors with the latest insights into the stock’s performance and outlook.
Read full news article Announcements
Announcement under Regulation 30 (LODR)-Analyst / Investor Meet - Intimation
28-Jul-2026 | Source : BSEIntimation of Q1 FY27 Earnings Conference Call
Board Meeting Intimation for Approval Of Un-Audited Financial Results For Quarter Ended June 30 2026.
24-Jul-2026 | Source : BSESuprajit Engineering Ltd-has informed BSE that the meeting of the Board of Directors of the Company is scheduled on 06/08/2026 inter alia to consider and approve the un-audited Standalone and Consolidated Financial results of the Company for the quarter ended June 30 2026.
Compliances-Certificate under Reg. 74 (5) of SEBI (DP) Regulations 2018
10-Jul-2026 | Source : BSECompliance Certificate under Regulation 74(5) of SEBI(DP) Regulations for quarter ended June 30 2026.
Corporate Actions

06 Aug 2026

Suprajit Engineering Ltd has declared 150% dividend, ex-date: 13 Feb 26

Suprajit Engineering Ltd has announced 1:5 stock split, ex-date: 18 Mar 10

Suprajit Engineering Ltd has announced 1:1 bonus issue, ex-date: 18 Mar 10

No Rights history available
Quality key factors
Valuation key factors
Technicals key factors
 Technical Indicator Scale: Bearish, Mildly Bearish, Sideways, Mildly Bullish, Bullish Turned
 Shareholding Snapshot : Jun 2026
Shareholding Compare (%holding)
Promoters
None
Held by 7 Schemes (16.53%)
Held by 89 FIIs (6.54%)
Supriyajith Family Trust (38.6%)
Hdfc Small Cap Fund (various Schemes) (9.78%)
23.93%
Quarterly Results Snapshot (Consolidated) - Mar'26 - QoQ

QoQ Growth in quarter ended Mar 2026 is 6.43% vs 4.03% in Dec 2025
QoQ Growth in quarter ended Mar 2026 is 467.52% vs -75.41% in Dec 2025
Half Yearly Results Snapshot (Consolidated) - Sep'25
Growth in half year ended Sep 2025 is 15.01% vs 12.96% in Sep 2024
Growth in half year ended Sep 2025 is 156.42% vs -43.10% in Sep 2024
Nine Monthly Results Snapshot (Consolidated) - Dec'25
YoY Growth in nine months ended Dec 2025 is 15.95% vs 13.60% in Dec 2024
YoY Growth in nine months ended Dec 2025 is 54.88% vs -33.38% in Dec 2024
Annual Results Snapshot (Consolidated) - Mar'26
YoY Growth in year ended Mar 2026 is 16.72% vs 13.16% in Mar 2025
YoY Growth in year ended Mar 2026 is 84.01% vs -40.65% in Mar 2025
About Suprajit Engineering Ltd

Company Coordinates


