Dolphin Offshore

INR
404.80
10.8 (2.74%)
BSENSE

Aug 03, 10:43 AM

BSE+NSE Vol: 18.68 k

  • Price Points
  • Score
  • Mojo Parameters
  • Total Return
  • News and Corporate Actions
  • Key factors
  • Shareholding
  • Financials
  • CompanyCV
stock-summaryPrice Point
High/Low

1Day

52 Week

Valuation
Technical
Day's Volume

CASH

18.68 k (924.51%) Volume

Shareholding (Jun 2026)

FII

4.57%

Held by 3 FIIs

DII

0.31%

Held by 0 DIIs

Promoter

74.99%

Why is Dolphin Offshore Enterprises (India) Ltd falling/rising?

02-Aug-2026

As of 02-Aug, Dolphin Offshore Enterprises (India) Ltd's stock price has risen to Rs 394.00, reflecting a 5.35% increase due to strong short-term performance and positive financial results, despite facing longer-term challenges. The stock's appeal is supported by impressive growth metrics and positive market sentiment.

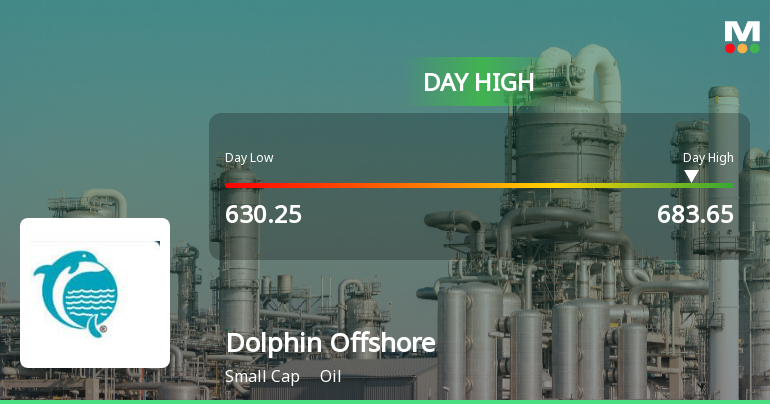
As of 02-Aug, Dolphin Offshore Enterprises (India) Ltd is experiencing a rise in its stock price, currently at Rs 394.00, which reflects an increase of Rs 20.0 or 5.35%. This upward movement can be attributed to several factors. <BR><BR>Firstly, the stock has outperformed the sector by 4.52% today and opened with a gain of 2.5%, indicating positive market sentiment. Additionally, the stock reached an intraday high of Rs 394.9, showcasing strong buying interest. The company has demonstrated a strong ability to service its debt, evidenced by a low Debt to EBITDA ratio of 2.81 times, which contributes to investor confidence.<BR><BR>Moreover, the company has shown impressive growth metrics, with net sales growing at an annual rate of 218.05% and operating profit increasing by 511.15%. The positive financial results reported for the latest six months, including a 98.07% growth in PAT to Rs 43.14 crore and a high ROCE of 13.32%, further bolster the stock's appeal.<BR><BR>Despite these positive indicators, it is important to note that the stock has faced challenges in the longer term, with a year-to-date decline of 17.58% and a one-year return of -9.09%. However, the recent performance suggests a potential turnaround, as the stock has shown a 7.28% increase over the past month, outperforming the Sensex, which only increased by 1.52% during the same period. <BR><BR>In summary, the current rise in Dolphin Offshore Enterprises (India) Ltd's stock price is primarily driven by strong short-term performance, positive financial results, and a favorable market reaction, despite its longer-term challenges.

View full answer

Are Dolphin Offshore Enterprises (India) Ltd latest results good or bad?

25-Jul-2026

Dolphin Offshore Enterprises (India) Ltd's latest results show strong year-on-year growth with a 30.71% increase in net profit and a 160.64% rise in revenue. However, there are concerns due to a significant sequential decline in both profit and revenue, along with reduced operating margins, indicating potential challenges ahead.

Dolphin Offshore Enterprises (India) Ltd's latest results present a mixed picture. On one hand, the company reported a net profit of ₹14.81 crores for Q1 FY27, which is a significant increase of 30.71% year-on-year. Additionally, revenue surged to ₹42.85 crores, reflecting a remarkable year-on-year growth of 160.64%. However, these positive year-on-year figures are somewhat overshadowed by a concerning sequential decline. Compared to the previous quarter (Q4 FY26), net profit dropped by 47.72%, and revenue decreased by 5.53%. <BR><BR>Moreover, the operating margin fell to 59.07%, down 15.88 percentage points from the previous quarter, indicating margin compression. The PAT margin also contracted significantly, raising questions about the sustainability of the company's recent operational improvements.<BR><BR>In summary, while the year-on-year growth figures are impressive, the sequential declines in both profit and revenue, coupled with margin pressures, suggest that the company's latest results are not entirely positive and warrant caution regarding future performance.

View full answer

Should I buy, sell or hold Dolphin Offshore Enterprises (India) Ltd?

25-Jul-2026

When is the next results date for Dolphin Offshore Enterprises (India) Ltd?

17-Jul-2026

The next results date for Dolphin Offshore Enterprises (India) Ltd is July 24, 2026.

The next results date for Dolphin Offshore Enterprises (India) Ltd is scheduled for July 24, 2026.

View full answer

How big is Dolphin Offshore?

11-Jun-2026

As of 10th June, Dolphin Offshore Enterprises (India) Ltd has a market capitalization of 1,573.00 Cr, with recent net sales of 116.42 Cr and net profit of 68.54 Cr over the last four quarters.

As of 10th June, <BR><BR>Market Cap: Dolphin Offshore Enterprises (India) Ltd has a market capitalization of 1,573.00 Cr, classifying it as a Micro Cap company.<BR><BR>Recent Quarterly Performance: The sum of Net Sales for the latest 4 quarters is 116.42 Cr, while the sum of Net Profit for the same period is 68.54 Cr.<BR><BR>Balance Sheet Snapshot: The reporting period for the latest annual data is March 2025. Shareholder's Funds amount to 272.40 Cr, and Total Assets are valued at 456.97 Cr.

View full answer

Who are in the management team of Dolphin Offshore?

11-Jun-2026

The management team of Dolphin Offshore includes Chairman Sabyasachi Hajara, Managing Director & CEO Satpal Singh, Joint Managing Director & CFO Navpreet Singh, and several other directors and executives overseeing the company's strategic direction and operations.

The management team of Dolphin Offshore includes the following key members:<BR><BR>1. **Sabyasachi Hajara** - Chairman<BR>2. **Satpal Singh** - Managing Director & CEO<BR>3. **Navpreet Singh** - Joint Managing Director & CFO<BR>4. **Kirpal Singh** - Promoter & Non-Executive Director<BR>5. **Faqir Chand Kohli** - Non-Executive Independent Director<BR>6. **Kiran Vaidya** - Non-Executive Independent Director<BR>7. **Manjit Kirpal Singh** - Promoter & Non-Executive Director<BR>8. **V Surendran** - Vice President (Corp & Legal) & Company Secretary<BR>9. **Dharen S Savla** - Chairman & Non-Executive Director<BR>10. **Shaily Dedhia** - Non-Executive Director<BR>11. **Rohan Ketanbhai Sanghvi** - Non-Executive Director<BR>12. **Krena Khamar** - Company Secretary & Compliance Officer<BR>13. **Ashokkumar Ratilal Patel** - Additional Director<BR>14. **Rupesh KantilaI Savlaas** - Managing Director<BR>15. **Rohan Vasantkumar Shah** - Additional Executive Director<BR>16. **Christopher Joseph Rodricks** - Additional Director<BR><BR>This team oversees the strategic direction and operations of the company.

View full answer

Who are the peers of the Dolphin Offshore?

11-Jun-2026

Dolphin Offshore's peers include Hind.Oil Explor., Panama Petrochem, Prabha Energy, Asian Energy, Jindal Drilling, Gandhar Oil Ref., Guj.Nat.Resour., Ganesh Benzopl., Rajasthan Securi, and Oil Country. In terms of performance, Dolphin Offshore shows below-average management risk and growth, with a 1-year return of 3.88%, compared to Guj.Nat.Resour.'s highest return of 59.55% and Prabha Energy's lowest at -36.00%.

Peers: Dolphin Offshore's peers include Hind.Oil Explor., Panama Petrochem, Prabha Energy, Asian Energy, Jindal Drilling, Gandhar Oil Ref., Guj.Nat.Resour., Ganesh Benzopl., Rajasthan Securi, and Oil Country.<BR><BR>Quality Snapshot: Excellent management risk is observed at Jindal Drilling, Asian Energy, and Ganesh Benzopl., while Average management risk is found at Hind.Oil Explor., Panama Petrochem, Gandhar Oil Ref., and Rajasthan Securi. Below Average management risk is noted for Prabha Energy, Guj.Nat.Resour., and Dolphin Offshore. In terms of Growth, Excellent growth is seen at Dolphin Offshore and Rajasthan Securi, while Good growth is noted at Jindal Drilling and Guj.Nat.Resour. Below Average growth is present at Hind.Oil Explor., Panama Petrochem, Prabha Energy, Asian Energy, and Ganesh Benzopl. The rest have Average growth. For Capital Structure, Excellent capital structure is found at Panama Petrochem, Asian Energy, and Jindal Drilling, while Good capital structure is noted for Dolphin Offshore, Hind.Oil Explor., and Gandhar Oil Ref. The rest have Below Average capital structure.<BR><BR>Return Snapshot: The peer with the highest 1-year return is Guj.Nat.Resour. at 59.55%, while Prabha Energy has the lowest at -36.00%. Dolphin Offshore's 1-year return is 3.88%, which is higher than Prabha Energy's but significantly lower than Guj.Nat.Resour.'s. Additionally, the peers with negative six-month returns include Prabha Energy and Oil Country.

View full answer

What does Dolphin Offshore do?

10-Jun-2026

Dolphin Offshore Enterprises (India) Ltd provides underwater services to the Indian oil and gas industry and is listed on the Bombay and National Stock Exchanges. As of March 2026, it reported net sales of 45 Cr and a net profit of 28 Cr, with a market cap of INR 1,573 Cr.

Overview:<BR>Dolphin Offshore Enterprises (India) Ltd is a leading provider of underwater services to the Indian oil and gas industry, operating within the micro-cap market segment.<BR><BR>History:<BR>Incorporated in May 1979 as a private limited company, Dolphin Offshore was converted into a public limited company in May 1994. The company went public with an Initial Public Offer in 1994 and is listed on the Bombay and National Stock Exchanges. The latest quarterly results reported net sales and profit for March 2026.<BR><BR>Financial Snapshot:<BR>- Net Sales: 45 Cr (Quarterly Results - Mar 2026)<BR>- Net Profit: 28 Cr (Quarterly Results - Mar 2026)<BR>- Market Cap: INR 1,573 Cr (Micro Cap)<BR><BR>Key Metrics:<BR>- P/E: 23.00<BR>- Industry P/E: 12<BR>- Dividend Yield: 0.00%<BR>- Debt-Equity: 0.45<BR>- Return on Equity: 19.39%<BR>- Price to Book: 4.42<BR><BR>Contact Details:<BR>Address: 1001 Raheja Centre, 214 Nariman Point Mumbai Maharashtra : 400021<BR>Tel: 91-22-22832226/34/42<BR>Email: customers@dolphinoffshore.com<BR>Website: http://www.dolphinoffshore.com

View full answer

Is Dolphin Offshore technically bullish or bearish?

19-Nov-2025

As of November 18, 2025, Dolphin Offshore's technical trend is mildly bearish, supported by bearish signals from the weekly MACD and KST, while daily moving averages show mild bullishness that isn't strong enough to counter the overall bearish sentiment.

As of 18 November 2025, the technical trend for Dolphin Offshore has changed from sideways to mildly bearish. The current stance is mildly bearish, driven by the weekly MACD and KST both indicating bearish signals, while the monthly indicators show a mildly bearish trend. The Bollinger Bands also confirm a bearish outlook on the weekly timeframe. Although the daily moving averages are mildly bullish, they are not strong enough to offset the bearish signals from the weekly and monthly indicators. The Dow Theory indicates a mildly bullish trend on the monthly, but the lack of a clear trend on the weekly adds to the overall bearish sentiment.

View full answer

How has been the historical performance of Dolphin Offshore?

12-Nov-2025

Dolphin Offshore's historical performance shows a strong recovery, with net sales rising from 6.47 Cr in March 2024 to 74.02 Cr in March 2025, resulting in a profit after tax of 46.48 Cr, up from 5.57 Cr the previous year. Total assets and liabilities also increased significantly, reflecting overall growth and improved cash flow.

Answer:<BR>The historical performance of Dolphin Offshore shows significant fluctuations in key financial metrics over the years.<BR><BR>Breakdown:<BR>Dolphin Offshore's net sales have seen a notable increase from 6.47 Cr in March 2024 to 74.02 Cr in March 2025, recovering from a period of no sales in the previous years. The total operating income followed a similar trend, rising to 74.02 Cr in March 2025 from 6.47 Cr in March 2024. The company's total expenditure, excluding depreciation, also increased to 28.14 Cr in March 2025, up from 9.97 Cr in March 2024. This resulted in an operating profit of 48.98 Cr in March 2025, a significant recovery from a loss of 3.50 Cr in March 2024. The profit before tax surged to 47.57 Cr in March 2025, compared to just 0.26 Cr in March 2024. Consequently, the profit after tax reached 46.48 Cr in March 2025, up from 5.57 Cr in March 2024. The company's total assets increased to 456.97 Cr in March 2025 from 222.15 Cr in March 2024, while total liabilities also rose to 456.97 Cr from 222.15 Cr in the same period. Cash flow from operating activities improved to 10.00 Cr in March 2025, compared to 3.00 Cr in March 2024, indicating a positive cash flow trend. Overall, Dolphin Offshore's financial performance in March 2025 reflects a strong recovery and growth trajectory compared to the previous year.

View full answer

Who are the top shareholders of the Dolphin Offshore?

17-Jul-2025

The top shareholder of Dolphin Offshore is Deep Onshore Services Private Limited, owning 74.99% of the shares. Other notable shareholders include Krishang Vaibhav Shah with 4%, individual investors with 14.78%, and foreign institutional investors holding 4.57%.

The top shareholders of Dolphin Offshore include Deep Onshore Services Private Limited, which holds a significant 74.99% of the shares, making it the largest promoter. Additionally, Krishang Vaibhav Shah is the highest public shareholder with a 4% stake. The company also has 14.78% of its shares held by individual investors. There are two foreign institutional investors (FIIs) that collectively hold 4.57% of the shares, while no mutual funds currently hold any shares in the company.

View full answer

Is Dolphin Offshore overvalued or undervalued?

09-Jun-2025

As of April 29, 2025, Dolphin Offshore is considered very expensive and overvalued with a PE ratio of 35.97 and an EV to EBITDA of 39.25, significantly higher than its peers like Reliance Industries and ONGC, and has underperformed the Sensex with a year-to-date return of -30.67%.

As of 29 April 2025, Dolphin Offshore's valuation grade has moved from risky to very expensive, indicating a significant shift in its perceived value. The company is currently overvalued, with a PE ratio of 35.97, an EV to EBITDA ratio of 39.25, and a Price to Book Value of 6.14. These ratios suggest that Dolphin Offshore is trading at a premium compared to its peers in the oil industry.<BR><BR>In comparison, Reliance Industries, which is considered fairly valued, has a PE ratio of 28.05 and an EV to EBITDA of 12.68, while ONGC, rated very attractive, boasts a PE ratio of just 8.31 and an EV to EBITDA of 4.65. The stark contrast in these ratios highlights Dolphin Offshore's overvaluation. Additionally, the company's stock has underperformed significantly against the Sensex, with a year-to-date return of -30.67% compared to the Sensex's 5.59%, further reinforcing the notion that it is currently overvalued.

View full answer

What is the bonus history of the Dolphin Offshore?

06-Jun-2025

Dolphin Offshore Enterprises (India) Ltd has issued bonuses twice: a 2:5 bonus on June 29, 2009, and a 3:5 bonus on January 11, 2007.

Dolphin Offshore Enterprises (India) Ltd has a history of bonus issues that includes two notable instances. <BR><BR>The most recent bonus was a 2:5 bonus issue, which was announced with an ex-date of June 29, 2009, and a record date of July 2, 2009. Prior to that, the company issued a 3:5 bonus on January 11, 2007, with a record date of January 12, 2007. <BR><BR>If you need more details or have further questions about Dolphin Offshore, feel free to ask!

View full answer

Has Dolphin Offshore declared dividend?

06-Jun-2025

Dolphin Offshore Enterprises (India) Ltd has declared a 15% dividend, amounting to ₹1.5 per share, with an ex-date of July 18, 2013. However, the current dividend yield is 0%, and total returns have varied significantly, showing negative returns in the short term but substantial gains over the longer term.

Dolphin Offshore Enterprises (India) Ltd has declared a 15% dividend.<BR><BR>Dividend Details:<BR>- Percentage announced: 15%<BR>- Amount per share: 1.5<BR>- Ex-date: Jul-18-2013<BR><BR>Dividend Yield: 0%<BR><BR>Total Returns by Period:<BR>In the 6 months period, the price return was -22.24%, the dividend return was 0%, resulting in a total return of -22.24%.<BR><BR>In the 1 year period, the price return was -39.3%, the dividend return was 0%, leading to a total return of -39.3%.<BR><BR>In the 2 years period, the price return was 0%, the dividend return was 0%, resulting in a total return of 0.0%.<BR><BR>In the 3 years period, the price return was 0%, the dividend return was 0%, leading to a total return of 0.0%.<BR><BR>In the 4 years period, the price return was 99421.53%, the dividend return was 0%, resulting in a total return of 99421.53%.<BR><BR>In the 5 years period, the price return was 99421.53%, the dividend return was 0%, leading to a total return of 99421.53%.<BR><BR>Overall, Dolphin Offshore has declared a dividend, but the dividend yield is currently 0%. The total returns over various periods show significant fluctuations, particularly a remarkable increase over the 4 and 5-year periods, despite negative returns in the shorter terms.

View full answer
iScoreScore
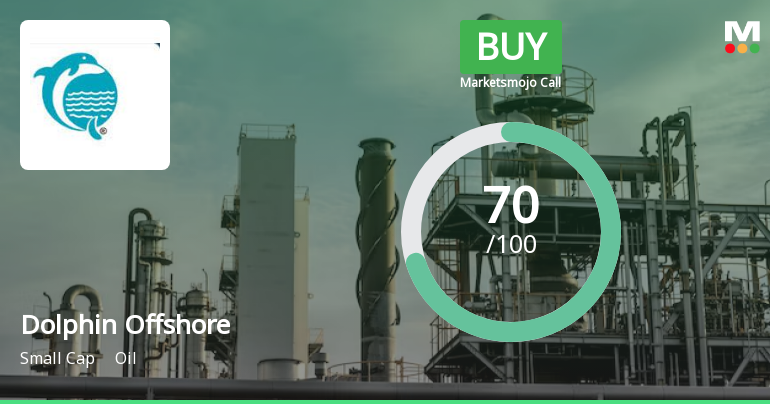
Click here to find our call on this stock
Strong Sell
Sell
Hold
Buy
Strong Buy

Dashboard

1

Poor Management Efficiency with a low ROCE of 7.50%

  • The company has been able to generate a Return on Capital Employed (avg) of 7.50% signifying low profitability per unit of total capital (equity and debt)
2

With ROCE of 11.1, it has a Very Expensive valuation with a 3.4 Enterprise value to Capital Employed

3

Below par performance in long term as well as near term

stock-summaryMojo Parameters

Mojo Parameters

Loading Valuation Snapshot...

Stock DNA

stock-summary
Industry

Oil

stock-summary
Market cap

INR 1,619 Cr (Small Cap)

stock-summary
P/E

22.00

stock-summary
Industry P/E

14

stock-summary
Dividend Yield

0.00%

stock-summary
Debt Equity

0.45

stock-summary
Return on Equity

19.39%

stock-summary
Price to Book

4.47

Revenue and Profits:
Net Sales:
43 Cr
(Quarterly Results - Jun 2026)
Net Profit:
15 Cr
stock-summaryTotal Returns
Total Returns (Price + Dividend) stock-summary
Dividend Yield (0%)
TimePeriod
Price Return
Dividend Return
Total Return
3 Months
-2.72%
0%
-2.72%
6 Months
-3.39%
0%
-3.39%
1 Year
-5.24%
0%
-5.24%
2 Years
-42.83%
0%
-42.83%
3 Years
0%
0%
0.0%
4 Years
0%
0%
0.0%
5 Years
0%
0%
0.0%

Latest dividend: 12 per share ex-dividend date: Jul-18-2013

Risk Adjusted Returns v/s stock-summary
Returns Beta
Icon
Beta has not been calculated since enough price history is not available
stock-summaryNews & Corporate Actions

News

Announcements stock-summary

Announcement under Regulation 30 (LODR)-Newspaper Publication

01-Aug-2026 | Source : BSE

Intimation for Newspaper publication

Notice Of 47Th Annual General Meeting

31-Jul-2026 | Source : BSE

Notice of 47th Annual General Meeting

Reg. 34 (1) Annual Report.

31-Jul-2026 | Source : BSE

Annual Report for the 47th annual general meeting of the company

Corporate Actions stock-summary

stock-summary
BOARD MEETING

No Upcoming Board Meetings

stock-summary
DIVIDEND

Dolphin Offshore Enterprises (India) Ltd has declared 15% dividend, ex-date: 18 Jul 13

stock-summary
SPLITS

Dolphin Offshore Enterprises (India) Ltd has announced 1:10 stock split, ex-date: 25 Jan 24

stock-summary
BONUS

Dolphin Offshore Enterprises (India) Ltd has announced 2:5 bonus issue, ex-date: 29 Jun 09

stock-summary
RIGHTS

No Rights history available

stock-summaryKey Factors

Quality key factors stock-summary

Factor
Value
Sales Growth (5y)
218.05%
EBIT Growth (5y)
511.15%
EBIT to Interest (avg)
5.17
Debt to EBITDA (avg)
0.93
Net Debt to Equity (avg)
0.45
Sales to Capital Employed (avg)
0.12
Tax Ratio
Tax Ratio is Negative%
Dividend Payout Ratio
0
Pledged Shares
0
Institutional Holding
4.89%
ROCE (avg)
4.84%
ROE (avg)
10.78%

Valuation key factors

Factor
Value
P/E Ratio
22
Industry P/E
14
Price to Book Value
4.47
EV to EBIT
27.21
EV to EBITDA
21.18
EV to Capital Employed
3.39
EV to Sales
12.17
PEG Ratio
0.51
Dividend Yield
NA
ROCE (Latest)
11.06%
ROE (Latest)
19.39%

Technicals key factors

Indicator
Weekly
Monthly
MACD
Bearish
Mildly Bearish
RSI
No Signal
No Signal
Bollinger Bands
Sideways
Mildly Bearish
Moving Averages
Mildly Bearish (Daily)
KST
Bearish
Mildly Bearish
Dow Theory
Mildly Bearish
Mildly Bearish
OBV
No Trend
Bullish
stock-summary Technical Indicator Scale: Bearish, Mildly Bearish, Sideways, Mildly Bullish, Bullish  Turned 
stock-summaryShareholding
Shareholding Snapshot : Jun 2026stock-summary
Shareholding Compare (%holding) stock-summary
Majority shareholders

Promoters

Pledged Promoter Holdings

None

Mutual Funds

Held by 0 Schemes

FIIs

Held by 3 FIIs (4.57%)

Promoter with highest holding

Deep Onshore Services Private Limited (74.99%)

Highest Public shareholder

Krishang Vaibhav Shah (4%)

Individual Investors Holdings

13.81%

stock-summaryFinancial
[
  {
    "link": "quarterly",
    "btn_text": "All Quarterly Results",
    "header": "Quarterly Results Snapshot (Consolidated) - Jun'26 - QoQ",
    "rhs": [
      {
        "prefix": "Net Sales ",
        "suffix": "QoQ Growth in quarter ended Jun 2026 is -5.53% vs 51.20% in Mar 2026",
        "dir": -1
      },
      {
        "prefix": "Consolidated Net Profit ",
        "suffix": "QoQ Growth in quarter ended Jun 2026 is -47.72% vs 113.49% in Mar 2026",
        "dir": -1
      }
    ],
    "table": {
      "header": [
        "Jun'26",
        "Mar'26",
        "Change(%)"
      ],
      "body": [
        {
          "field": "Net Sales",
          "val1": "42.85",
          "val2": "45.36",
          "chgp": "-5.53%",
          "chgp_class": "negative"
        },
        {
          "field": "Operating Profit (PBDIT) excl Other Income",
          "val1": "25.31",
          "val2": "12.29",
          "chgp": "105.94%",
          "chgp_class": "positive"
        },
        {
          "field": "Interest",
          "val1": "3.96",
          "val2": "4.87",
          "chgp": "-18.69%",
          "chgp_class": "positive"
        },
        {
          "field": "Exceptional Items",
          "val1": "0.00",
          "val2": "0.00",
          "chgp": "",
          "chgp_class": "neutral"
        },
        {
          "field": "Consolidate Net Profit",
          "val1": "14.81",
          "val2": "28.33",
          "chgp": "-47.72%",
          "chgp_class": "negative"
        },
        {
          "field": "Operating Profit Margin (Excl OI)",
          "val1": "59.07%",
          "val2": "27.09%",
          "chgp": "31.98%",
          "chgp_class": "positive"
        }
      ]
    }
  },
  {
    "link": "half-yearly",
    "btn_text": "All Half Yearly Results",
    "header": "Half Yearly Results Snapshot (Consolidated) - Sep'25",
    "rhs": [
      {
        "prefix": "Net Sales ",
        "suffix": " Growth in half year ended Sep 2025 is 63.78% vs 814.96% in Sep 2024",
        "dir": -1
      },
      {
        "prefix": "Consolidated Net Profit ",
        "suffix": " Growth in half year ended Sep 2025 is 31.61% vs 459.29% in Sep 2024",
        "dir": -1
      }
    ],
    "table": {
      "header": [
        "Sep'25",
        "Sep'24",
        "Change(%)"
      ],
      "body": [
        {
          "field": "Net Sales",
          "val1": "41.06",
          "val2": "25.07",
          "chgp": "63.78%",
          "chgp_class": "positive"
        },
        {
          "field": "Operating Profit (PBDIT) excl Other Income",
          "val1": "37.62",
          "val2": "18.84",
          "chgp": "99.68%",
          "chgp_class": "positive"
        },
        {
          "field": "Interest",
          "val1": "5.77",
          "val2": "0.08",
          "chgp": "7,112.50%",
          "chgp_class": "negative"
        },
        {
          "field": "Exceptional Items",
          "val1": "0.00",
          "val2": "0.00",
          "chgp": "",
          "chgp_class": "neutral"
        },
        {
          "field": "Consolidate Net Profit",
          "val1": "26.94",
          "val2": "20.47",
          "chgp": "31.61%",
          "chgp_class": "positive"
        },
        {
          "field": "Operating Profit Margin (Excl OI)",
          "val1": "91.62%",
          "val2": "75.15%",
          "chgp": "16.47%",
          "chgp_class": "positive"
        }
      ]
    }
  },
  {
    "link": "nine-monthly",
    "btn_text": "All Nine Monthly Results",
    "header": "Nine Monthly Results Snapshot (Consolidated) - Dec'25",
    "rhs": [
      {
        "prefix": "Net Sales ",
        "suffix": "YoY Growth in nine months ended Dec 2025 is 32.65% vs 1,085.18% in Dec 2024",
        "dir": -1
      },
      {
        "prefix": "Consolidated Net Profit ",
        "suffix": "YoY Growth in nine months ended Dec 2025 is 11.60% vs 776.64% in Dec 2024",
        "dir": -1
      }
    ],
    "table": {
      "header": [
        "Dec'25",
        "Dec'24",
        "Change(%)"
      ],
      "body": [
        {
          "field": "Net Sales",
          "val1": "71.06",
          "val2": "53.57",
          "chgp": "32.65%",
          "chgp_class": "positive"
        },
        {
          "field": "Operating Profit (PBDIT) excl Other Income",
          "val1": "60.08",
          "val2": "34.55",
          "chgp": "73.89%",
          "chgp_class": "positive"
        },
        {
          "field": "Interest",
          "val1": "9.37",
          "val2": "0.35",
          "chgp": "2,577.14%",
          "chgp_class": "negative"
        },
        {
          "field": "Exceptional Items",
          "val1": "0.00",
          "val2": "0.00",
          "chgp": "",
          "chgp_class": "neutral"
        },
        {
          "field": "Consolidate Net Profit",
          "val1": "40.21",
          "val2": "36.03",
          "chgp": "11.60%",
          "chgp_class": "positive"
        },
        {
          "field": "Operating Profit Margin (Excl OI)",
          "val1": "84.55%",
          "val2": "64.50%",
          "chgp": "20.05%",
          "chgp_class": "positive"
        }
      ]
    }
  },
  {
    "link": "annual",
    "btn_text": "All Annual Results",
    "header": "Annual Results Snapshot (Consolidated) - Mar'26",
    "rhs": [
      {
        "prefix": "Net Sales ",
        "suffix": "YoY Growth in year ended Mar 2026 is 57.28% vs 1,044.05% in Mar 2025",
        "dir": -1
      },
      {
        "prefix": "Consolidated Net Profit ",
        "suffix": "YoY Growth in year ended Mar 2026 is 47.46% vs 734.47% in Mar 2025",
        "dir": -1
      }
    ],
    "table": {
      "header": [
        "Mar'26",
        "Mar'25",
        "Change(%)"
      ],
      "body": [
        {
          "field": "Net Sales",
          "val1": "116.42",
          "val2": "74.02",
          "chgp": "57.28%",
          "chgp_class": "positive"
        },
        {
          "field": "Operating Profit (PBDIT) excl Other Income",
          "val1": "72.38",
          "val2": "45.88",
          "chgp": "57.76%",
          "chgp_class": "positive"
        },
        {
          "field": "Interest",
          "val1": "14.24",
          "val2": "1.21",
          "chgp": "1,076.86%",
          "chgp_class": "negative"
        },
        {
          "field": "Exceptional Items",
          "val1": "0.00",
          "val2": "0.00",
          "chgp": "",
          "chgp_class": "neutral"
        },
        {
          "field": "Consolidate Net Profit",
          "val1": "68.54",
          "val2": "46.48",
          "chgp": "47.46%",
          "chgp_class": "positive"
        },
        {
          "field": "Operating Profit Margin (Excl OI)",
          "val1": "62.17%",
          "val2": "61.98%",
          "chgp": "0.19%",
          "chgp_class": "positive"
        }
      ]
    }
  }
]

Quarterly Results Snapshot (Consolidated) - Jun'26 - QoQstock-summary

Jun'26
Mar'26
Change(%)
Net Sales
42.85
45.36
-5.53%
Operating Profit (PBDIT) excl Other Income
25.31
12.29
105.94%
Interest
3.96
4.87
-18.69%
Exceptional Items
0.00
0.00
Consolidate Net Profit
14.81
28.33
-47.72%
Operating Profit Margin (Excl OI)
59.07%
27.09%
31.98%
Values in Rs Cr.
Direction Arrows
Net Sales

QoQ Growth in quarter ended Jun 2026 is -5.53% vs 51.20% in Mar 2026

Direction Arrows
Consolidated Net Profit

QoQ Growth in quarter ended Jun 2026 is -47.72% vs 113.49% in Mar 2026

Half Yearly Results Snapshot (Consolidated) - Sep'25stock-summary

Sep'25
Sep'24
Change(%)
Net Sales
41.06
25.07
63.78%
Operating Profit (PBDIT) excl Other Income
37.62
18.84
99.68%
Interest
5.77
0.08
7,112.50%
Exceptional Items
0.00
0.00
Consolidate Net Profit
26.94
20.47
31.61%
Operating Profit Margin (Excl OI)
91.62%
75.15%
16.47%
Values in Rs Cr.
Direction Arrows
Net Sales

Growth in half year ended Sep 2025 is 63.78% vs 814.96% in Sep 2024

Direction Arrows
Consolidated Net Profit

Growth in half year ended Sep 2025 is 31.61% vs 459.29% in Sep 2024

Nine Monthly Results Snapshot (Consolidated) - Dec'25stock-summary

Dec'25
Dec'24
Change(%)
Net Sales
71.06
53.57
32.65%
Operating Profit (PBDIT) excl Other Income
60.08
34.55
73.89%
Interest
9.37
0.35
2,577.14%
Exceptional Items
0.00
0.00
Consolidate Net Profit
40.21
36.03
11.60%
Operating Profit Margin (Excl OI)
84.55%
64.50%
20.05%
Values in Rs Cr.
Direction Arrows
Net Sales

YoY Growth in nine months ended Dec 2025 is 32.65% vs 1,085.18% in Dec 2024

Direction Arrows
Consolidated Net Profit

YoY Growth in nine months ended Dec 2025 is 11.60% vs 776.64% in Dec 2024

Annual Results Snapshot (Consolidated) - Mar'26stock-summary

Mar'26
Mar'25
Change(%)
Net Sales
116.42
74.02
57.28%
Operating Profit (PBDIT) excl Other Income
72.38
45.88
57.76%
Interest
14.24
1.21
1,076.86%
Exceptional Items
0.00
0.00
Consolidate Net Profit
68.54
46.48
47.46%
Operating Profit Margin (Excl OI)
62.17%
61.98%
0.19%
Values in Rs Cr.
Direction Arrows
Net Sales

YoY Growth in year ended Mar 2026 is 57.28% vs 1,044.05% in Mar 2025

Direction Arrows
Consolidated Net Profit

YoY Growth in year ended Mar 2026 is 47.46% vs 734.47% in Mar 2025

stock-summaryCompany CV
About Dolphin Offshore Enterprises (India) Ltd stock-summary
stock-summary
Dolphin Offshore Enterprises (India) Ltd
Small Cap
Oil
Incorporated in May 1979 as a private limited Company, Dolphin Offshore Enterprises (India) Limited (DOEIL) was converted into a public Limited Company in May '94. It was promoted by Kirpal Singh. The Company went in for Initial Public Offer in 1994 and got its shares listed on the Bombay and National Stock Exchanges. The Company is a leading provider of underwater services to the Indian oil and gas industry.
Company Coordinates stock-summary
Company Details
1001 Raheja Centre, 214 Nariman Point Mumbai Maharashtra : 400021
stock-summary
Tel: 91-22-22832226/34/42
stock-summary
customers@dolphinoffshore.com
Registrar Details
Sharex Dynamic (India) Pvt Ltd , Unit -1, Luthra Ind. Premises , Safed Pool, Andheri-Kurla Road, Andheri (E), Mumbai