
Compare FGP with Similar Stocks
Dashboard
With a Operating Losses, the company has a Weak Long Term Fundamental Strength
- Company's ability to service its debt is weak with a poor EBIT to Interest (avg) ratio of -0.58
- The company has been able to generate a Return on Equity (avg) of 1.95% signifying low profitability per unit of shareholders funds
Flat results in Mar 26
Risky - Negative EBITDA
Stock DNA
Non Banking Financial Company (NBFC)
INR 13 Cr (Micro Cap)
179.00
37
0.00%
-1.04
2.05%
3.65
Total Returns (Price + Dividend) 
FGP for the last several years.
Risk Adjusted Returns v/s
Returns Beta

News
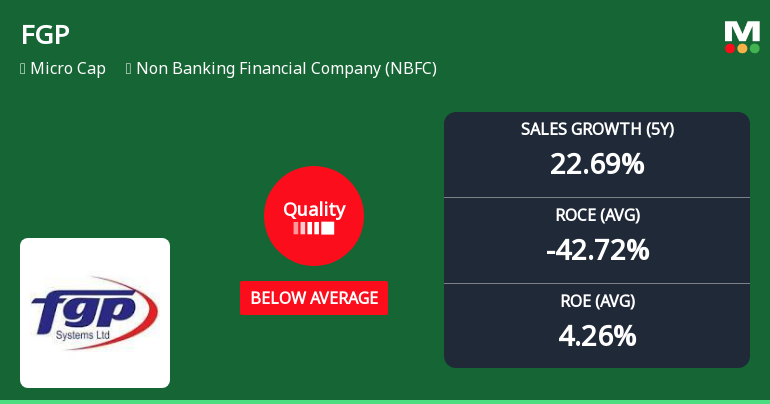
FGP Ltd Quality Grade Downgrade Highlights Fundamental Challenges
FGP Ltd, a micro-cap player in the Non Banking Financial Company (NBFC) sector, has seen its quality grade downgraded from "Does Not Qualify" to "Below Average" as of 30 April 2026. This shift reflects a nuanced change in the company’s financial fundamentals, with mixed signals from key metrics such as return on equity (ROE), return on capital employed (ROCE), debt levels, and growth consistency. Investors should carefully consider these developments in the context of FGP’s recent performance and sector dynamics.
Read full news articleAre FGP Ltd latest results good or bad?
The latest financial results for FGP Ltd. for the quarter ended March 2026 reveal a complex picture characterized by significant revenue growth alongside persistent operational challenges. The company reported net sales of ₹1.73 crores, reflecting a remarkable quarter-on-quarter increase of 2,371.43% from ₹0.07 crores in the previous quarter. However, this surge in revenue did not translate into profitability, as FGP Ltd. recorded a net loss of ₹0.29 crores, a stark contrast to the profit of ₹0.04 crores in the prior quarter. The operating profit before depreciation, interest, and tax (PBDIT) also showed a loss of ₹0.35 crores, indicating a deeply negative operating margin of -20.23%, which represents a decline from the -6% margin in the previous quarter. This performance marks the worst quarterly operating results in recent periods, highlighting ongoing operational inefficiencies. Moreover, the company’s...
Read full news article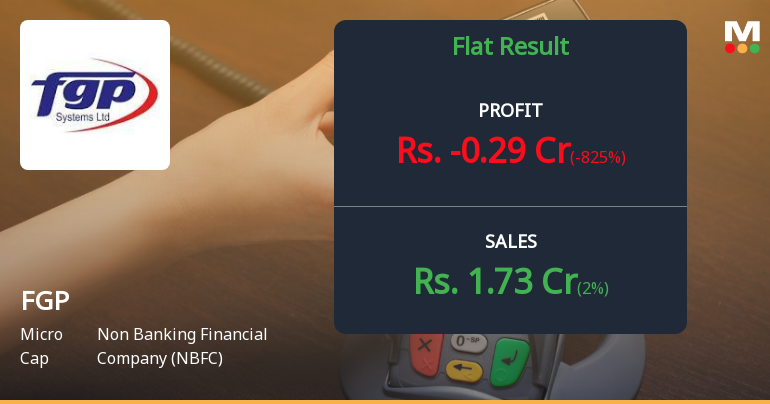
FGP Ltd Q4 FY26: Micro-Cap NBFC Posts Loss Amid Revenue Volatility
FGP Ltd., a micro-cap non-banking financial company with a market capitalisation of ₹13.00 crores, reported a net loss of ₹0.29 crores for Q4 FY26, marking a sharp reversal from the modest profit of ₹0.27 crores in the preceding quarter. The company's shares traded at ₹10.48 on April 30, 2026, reflecting continued volatility in a stock that has delivered exceptional five-year returns of 580.52% despite persistent operational challenges and minimal institutional interest.
Read full news article Announcements
Reg. 34 (1) Annual Report.
13-Jul-2026 | Source : BSECorrigendum to the Annual Report for the Financial Year 2025-26.
Announcement under Regulation 30 (LODR)-Newspaper Publication
03-Jul-2026 | Source : BSEPursuant to Regulation 30 of SEBI(LODR) Regulations 2015 please find enclosed herewith the copy of Notice of 64th AGM published in todays newspaper as intimation of completion of dispatch of Notice of AGM and information relating to E-voting.
Intimation Under Regulation 30 Regarding Letter Dispatched To The Shareholders Of The Company
03-Jul-2026 | Source : BSEIntimation under Regulation 30 of SEBI (LODR) 2015 regarding dispatch to those shareholders whose email addresses are not registered with Company/RTA/Depository stating the web link where the Annual Report is uploaded on website.
Corporate Actions

No Upcoming Board Meetings

No Dividend history available

No Splits history available

No Bonus history available

No Rights history available
Quality key factors
Valuation key factors
Technicals key factors
 Technical Indicator Scale: Bearish, Mildly Bearish, Sideways, Mildly Bullish, Bullish Turned
 Shareholding Snapshot : Jun 2026
Shareholding Compare (%holding)
Non Institution
None
Held by 0 Schemes
Held by 9 FIIs (0.1%)
Swallow Associates Llp (24.26%)
Life Insurance Corporation Of India (3.09%)
47.89%
Quarterly Results Snapshot (Standalone) - Mar'26 - QoQ

QoQ Growth in quarter ended Mar 2026 is 2,371.43% vs 0.00% in Dec 2025

QoQ Growth in quarter ended Mar 2026 is -825.00% vs -20.00% in Dec 2025
Half Yearly Results Snapshot (Standalone) - Sep'25
Growth in half year ended Sep 2025 is 8.33% vs 20.00% in Sep 2024
Growth in half year ended Sep 2025 is -8.57% vs 400.00% in Sep 2024
Nine Monthly Results Snapshot (Standalone) - Dec'25
YoY Growth in nine months ended Dec 2025 is 11.11% vs 20.00% in Dec 2024
YoY Growth in nine months ended Dec 2025 is 176.92% vs -13.33% in Dec 2024
Annual Results Snapshot (Standalone) - Mar'26
YoY Growth in year ended Mar 2026 is 756.52% vs 15.00% in Mar 2025
YoY Growth in year ended Mar 2026 is 333.33% vs -111.54% in Mar 2025
About FGP Ltd

Company Coordinates


