
Compare Websol Energy with Similar Stocks
Dashboard
Strong ability to service debt as the company has a low Debt to EBITDA ratio of 0.50 times
Healthy long term growth as Net Sales has grown by an annual rate of 46.86% and Operating profit at 81.99%
With a growth in Net Profit of 91.6%, the company declared Outstanding results in Mar 26
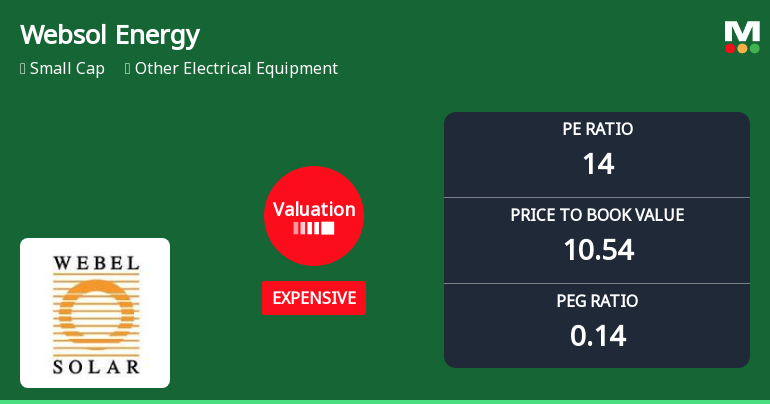
With ROCE of 73.8, it has a Expensive valuation with a 8.5 Enterprise value to Capital Employed
89.39% of Promoter Shares are Pledged
Stock DNA
Other Electrical Equipment
INR 4,170 Cr (Small Cap)
14.00
29
0.00%
0.27
77.52%
10.54
Total Returns (Price + Dividend) 
Latest dividend: 0.05 per share ex-dividend date: Sep-14-2009
Risk Adjusted Returns v/s
Returns Beta

News
Websol Energy System Ltd Valuation Shifts Signal Renewed Investor Interest
Websol Energy System Ltd has experienced a notable shift in its valuation parameters, moving from a very expensive to an expensive rating. This change reflects evolving market perceptions and impacts the stock’s price attractiveness relative to its historical and peer benchmarks. Investors should carefully analyse these valuation metrics alongside the company’s robust financial performance and sector dynamics to gauge future prospects.
Read full news article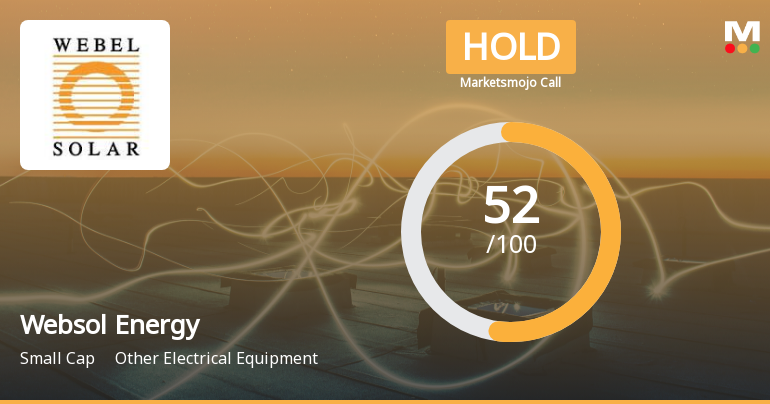
Websol Energy System Ltd is Rated Hold
Websol Energy System Ltd is rated 'Hold' by MarketsMOJO, with this rating last updated on 23 April 2026. However, the analysis and financial metrics discussed below reflect the company’s current position as of 25 July 2026, providing investors with an up-to-date view of the stock’s fundamentals, valuation, financial trends, and technical outlook.
Read full news article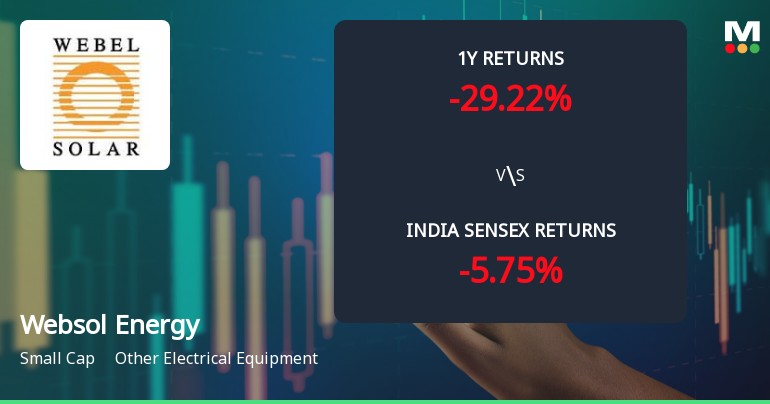
Websol Energy System Ltd Technical Momentum Shifts Amid Mixed Market Signals
Websol Energy System Ltd, a small-cap player in the Other Electrical Equipment sector, has experienced a notable shift in its technical momentum, reflecting a complex interplay of bullish and bearish signals across multiple timeframes. Despite a recent downgrade in price and a mildly bearish weekly and monthly technical trend, the stock’s year-to-date returns remain robust, outperforming the Sensex by a significant margin.
Read full news article Announcements
Shareholder Meeting / Postal Ballot-Outcome of Postal_Ballot
27-Jul-2026 | Source : BSEOutcome of Postal Ballot and Scrutinizers Report
Board Meeting Intimation for Consideration And Approval Of The Unaudited Standalone And Consolidated Financial Results Of The Company For The Quarter Ended 30Th June 2026.
24-Jul-2026 | Source : BSEWebsol Energy System Ltdhas informed BSE that the meeting of the Board of Directors of the Company is scheduled on 10/08/2026 inter alia to consider and approve the Unaudited standalone and consolidated financial results of the Company for the quarter ended 30th June 2026.
Compliances-Certificate under Reg. 74 (5) of SEBI (DP) Regulations 2018
09-Jul-2026 | Source : BSECertificate pursuant to Regulation 74(5) of SEBI (Depositories and Participants) Regulations 2018 for the quarter ended 30th June 2026
Corporate Actions

10 Aug 2026

Websol Energy System Ltd has declared 10% dividend, ex-date: 14 Sep 09

Websol Energy System Ltd has announced 1:10 stock split, ex-date: 14 Nov 25

Websol Energy System Ltd has announced 1:1 bonus issue, ex-date: 29 Dec 09

No Rights history available
Quality key factors
Valuation key factors
Technicals key factors
 Technical Indicator Scale: Bearish, Mildly Bearish, Sideways, Mildly Bullish, Bullish Turned
 Shareholding Snapshot : Jun 2026
Shareholding Compare (%holding)
Non Institution
89.3905
Held by 12 Schemes (0.43%)
Held by 38 FIIs (3.74%)
S L Industries Pvt Ltd (13.05%)
Amit Mishra (1.73%)
57.96%
Quarterly Results Snapshot (Standalone) - Mar'26 - QoQ

QoQ Growth in quarter ended Mar 2026 is 53.80% vs 55.17% in Dec 2025

QoQ Growth in quarter ended Mar 2026 is 91.60% vs 40.28% in Dec 2025
Half Yearly Results Snapshot (Standalone) - Sep'25
Growth in half year ended Sep 2025 is 51.66% vs 53,058.33% in Sep 2024
Growth in half year ended Sep 2025 is 74.88% vs 825.14% in Sep 2024
Nine Monthly Results Snapshot (Standalone) - Dec'25
YoY Growth in nine months ended Dec 2025 is 61.00% vs 40,553.54% in Dec 2024
YoY Growth in nine months ended Dec 2025 is 67.65% vs 267.42% in Dec 2024
Annual Results Snapshot (Standalone) - Mar'26
YoY Growth in year ended Mar 2026 is 82.37% vs 2,125.29% in Mar 2025
YoY Growth in year ended Mar 2026 is 95.81% vs 227.93% in Mar 2025
About Websol Energy System Ltd

Company Coordinates


