
Compare Oil Country with Similar Stocks
Dashboard
Weak Long Term Fundamental Strength with a -150.00% CAGR growth in Operating Profits over the last 5 years
- Low ability to service debt as the company has a high Debt to EBITDA ratio of 5.42 times
- The company has reported losses. Due to this company has reported negative ROCE
The company has declared negative results for the last 3 consecutive quarters
Risky - Negative Operating Profits
Underperformed the market in the last 1 year
Stock DNA
Oil
INR 294 Cr (Micro Cap)
NA (Loss Making)
26
0.00%
0.05
-31.15%
1.50
Total Returns (Price + Dividend) 
Latest dividend: 2.0000 per share ex-dividend date: May-29-2014
Risk Adjusted Returns v/s
Returns Beta

News

Oil Country Tubular Ltd is Rated Strong Sell
Oil Country Tubular Ltd is rated Strong Sell by MarketsMOJO, with this rating last updated on 20 Oct 2025. However, the analysis and financial metrics discussed here reflect the stock's current position as of 11 June 2026, providing investors with an up-to-date view of the company’s fundamentals, returns, and market performance.
Read full news article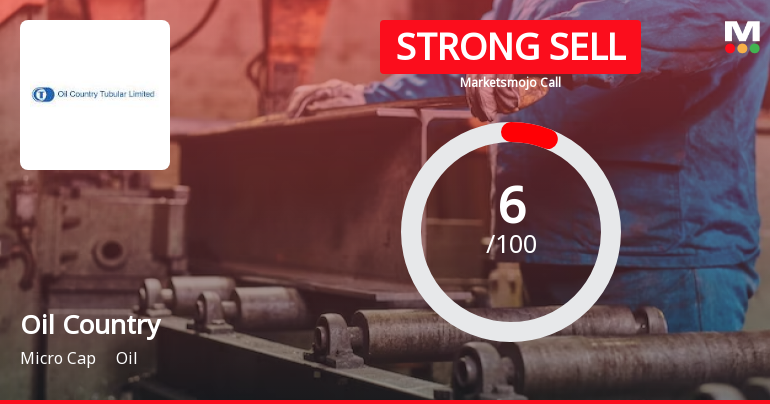
Oil Country Tubular Ltd is Rated Strong Sell
Oil Country Tubular Ltd is rated Strong Sell by MarketsMOJO. This rating was last updated on 20 Oct 2025, reflecting a significant reassessment of the stock’s outlook. However, the analysis and financial metrics discussed here represent the company’s current position as of 29 May 2026, providing investors with the latest insights into its performance and prospects.
Read full news article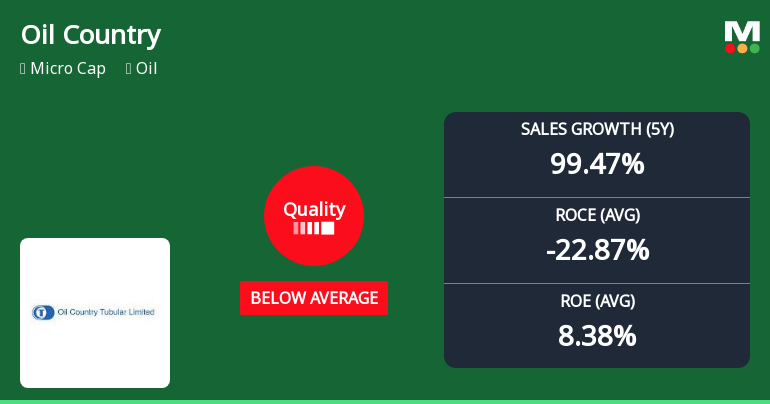
Oil Country Tubular Ltd Quality Grade Downgrade Highlights Fundamental Challenges
Oil Country Tubular Ltd, a micro-cap player in the oil sector, has seen a significant downgrade in its quality grading from average to below average, prompting MarketsMOJO to revise its rating from Sell to Strong Sell as of 20 Oct 2025. This shift reflects deteriorating business fundamentals, including worsening returns on equity and capital employed, alongside troubling debt metrics and inconsistent earnings performance.
Read full news article Announcements
Board Meeting Outcome for Outcome Of The Board Meeting Held On 18Th June 2026
18-Jun-2026 | Source : BSEOutcome of the Board Meeting held on 18th June 2026
Disclosure Under Regulation 30 Of Securities And Exchange Board Of India (Listing Obligations And Disclosure Requirements) Regulations 2015.
03-Jun-2026 | Source : BSEDisclosure under Regulation 30 of SEBI (LODR) Regulations 2015 regarding receipt of Show Cause Notice by SEBI.
Compliances-Reg.24(A)-Annual Secretarial Compliance
23-May-2026 | Source : BSEIntimation of Annual Secretarial Compliance Report for FY ended on 31st March 2026.
Corporate Actions

No Upcoming Board Meetings

Oil Country Tubular Ltd has declared 20% dividend, ex-date: 29 May 14

No Splits history available

No Bonus history available

No Rights history available
Quality key factors
Valuation key factors
Technicals key factors
 Technical Indicator Scale: Bearish, Mildly Bearish, Sideways, Mildly Bullish, Bullish Turned
 Shareholding Snapshot : Mar 2026
Shareholding Compare (%holding)
Non Institution
None
Held by 5 Schemes (0.05%)
Held by 2 FIIs (0.02%)
United Steel Allied Industries Pvt Ltd (33.18%)
Vivek Mundra (9.5%)
36.07%
Quarterly Results Snapshot (Standalone) - Mar'26 - YoY

YoY Growth in quarter ended Mar 2026 is -13.02% vs 204.07% in Mar 2025
YoY Growth in quarter ended Mar 2026 is -29.41% vs 28.01% in Mar 2025
Half Yearly Results Snapshot (Standalone) - Sep'25
Growth in half year ended Sep 2025 is -26.90% vs 4,782.47% in Sep 2024
Growth in half year ended Sep 2025 is -32.27% vs 31.56% in Sep 2024
Nine Monthly Results Snapshot (Standalone) - Dec'25
YoY Growth in nine months ended Dec 2025 is -54.57% vs 1,174.39% in Dec 2024
YoY Growth in nine months ended Dec 2025 is -124.39% vs 57.10% in Dec 2024
Annual Results Snapshot (Standalone) - Mar'26
YoY Growth in year ended Mar 2026 is -42.97% vs 573.79% in Mar 2025
YoY Growth in year ended Mar 2026 is -92.97% vs 54.78% in Mar 2025
About Oil Country Tubular Ltd

Company Coordinates


