
Compare Sreechem Resins with Similar Stocks
Dashboard
Weak Long Term Fundamental Strength with a -167.51% CAGR growth in Operating Profits over the last 5 years
- Company's ability to service its debt is weak with a poor EBIT to Interest (avg) ratio of 1.84
Risky - Negative Operating Profits
Below par performance in long term as well as near term
Stock DNA
Commodity Chemicals
INR 12 Cr (Micro Cap)
NA (Loss Making)
NA
0.00%
0.15
-1.40%
0.84
Total Returns (Price + Dividend) 
Sreechem Resins for the last several years.
Risk Adjusted Returns v/s
Returns Beta

News
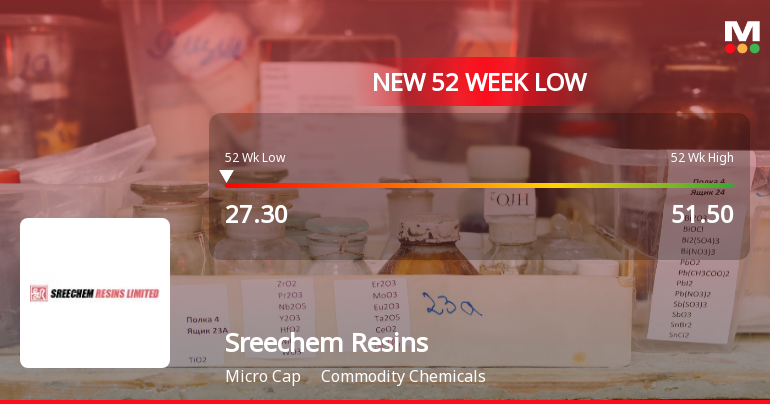
Sreechem Resins Ltd. Falls to 52-Week Low of Rs 27.3 as Sell-Off Deepens
For the fifth consecutive session, Sreechem Resins Ltd. closed lower, breaching its 52-week low at Rs 27.3 on 31 Jul 2026. This decline comes amid a broader market rally, with the Sensex gaining 0.28% and several indices hitting new highs, highlighting a stark divergence in performance.
Read full news article
Sreechem Resins Ltd. Downgraded to Strong Sell Amid Technical Weakness and Long-Term Challenges
Sreechem Resins Ltd., a micro-cap player in the commodity chemicals sector, has seen its investment rating downgraded from Sell to Strong Sell as of 30 June 2026. This revision follows a deterioration in technical indicators, weak long-term financial trends, and challenging valuation metrics, despite some positive quarterly financial results. The downgrade reflects growing concerns over the company’s ability to sustain profitability and generate shareholder value in a competitive market environment.
Read full news article
Sreechem Resins Ltd. Upgraded to Sell on Technical Improvements Despite Weak Fundamentals
Sreechem Resins Ltd., a micro-cap player in the commodity chemicals sector, has seen its investment rating upgraded from Strong Sell to Sell as of 22 June 2026. This change is primarily driven by an improvement in technical indicators, even as the company continues to grapple with weak long-term fundamentals and valuation concerns. The nuanced shift reflects a complex interplay of quality, valuation, financial trends, and technical factors that investors should carefully consider.
Read full news article Announcements
Re-Appointment Of Mr. Bimal Kumar Choraria Chartered Accountant As The Internal Auditor Of The Company.
24-Jul-2026 | Source : BSEIn compliance with Regulation 30 of Securities and Exchange Board of India (Listing Obligations and Disclosure Requirements) Regulations 2015 (SEBI Listing Regulations) the Board of Directors of the company at its meeting held on Friday may 29 2026 considered and approved the re-appointment of Mr. Bimal Kumar Choraria Chartered Accountant as the Internal Auditors of the Company to conduct internal audit of the Company for the financial year 2026-2027.The details required under Regulation 30 of SEBI (Listing Obligation and Disclosure Requirements) Regulations 2015 read with SEBI Circular No SEBI/HO/CFD/CFDPoD1/P/CIR/2023/123 dated 13th July 2023 is attached herewith.
Re-Appointment Of Mr. Navin Kothari Of M/S. N K &Associates Company Secretaries As The Secretarial Auditor.
24-Jul-2026 | Source : BSEIn compliance with Regulation 30 of the Securities and Exchange Board of India (Listing Obligations and Disclosure Requirements) Regulations 2015 (SEBI Listing Regulations) the Board of Directors of the Company at its meeting held on Friday May 29 2026 considered and approved the Re-Appointment of Mr. Navin Kothari of M/s. N K & Associates Company Secretaries as the Secretarial Auditor of the Company for the financial year 2026-2027.The details required under Regulation 30 of SEBI (Listing Obligation and Disclosure Requirements) Regulations 2015 read with SEBI Circular No SEBI/HO/CFD/CFDPoD1/PCIR/2023/123 dated 13th July 2023 is attached herewith.
Compliances-Certificate under Reg. 74 (5) of SEBI (DP) Regulations 2018
08-Jul-2026 | Source : BSEWith reference to the captioned matter please find enclosed herewith a Certificate under Regulation 74(5) of SEBI (Depositories and Participants) Regulations 2018 for the Quarter ended June 30 2026 received from M/s MCS Share Transfer Agent Limited Registrar and Share Transfer Agent of our Company. Kindly take the same on record and oblige.
Corporate Actions

No Upcoming Board Meetings

No Dividend history available

No Splits history available

No Bonus history available

No Rights history available
Quality key factors
Valuation key factors
Technicals key factors
 Technical Indicator Scale: Bearish, Mildly Bearish, Sideways, Mildly Bullish, Bullish Turned
 Shareholding Snapshot : Jun 2026
Shareholding Compare (%holding)
Non Institution
None
Held by 0 Schemes
Held by 0 FIIs
Satya Narayan Kabra (10.6%)
Kasturi Fiscal Pvt Ltd (11.49%)
50.73%
Quarterly Results Snapshot (Standalone) - Mar'26 - QoQ

QoQ Growth in quarter ended Mar 2026 is 16.15% vs 3.21% in Dec 2025
QoQ Growth in quarter ended Mar 2026 is 290.91% vs 3.51% in Dec 2025
Half Yearly Results Snapshot (Standalone) - Sep'25

Growth in half year ended Sep 2025 is -11.13% vs 10.63% in Sep 2024
Growth in half year ended Sep 2025 is -40.00% vs 25.37% in Sep 2024
Nine Monthly Results Snapshot (Standalone) - Dec'25
YoY Growth in nine months ended Dec 2025 is -17.81% vs -24.06% in Dec 2024
YoY Growth in nine months ended Dec 2025 is -50.60% vs -154.61% in Dec 2024
Annual Results Snapshot (Standalone) - Mar'26
YoY Growth in year ended Mar 2026 is -16.20% vs -32.98% in Mar 2025
YoY Growth in year ended Mar 2026 is 23.33% vs -112.82% in Mar 2025
About Sreechem Resins Ltd.

Company Coordinates


